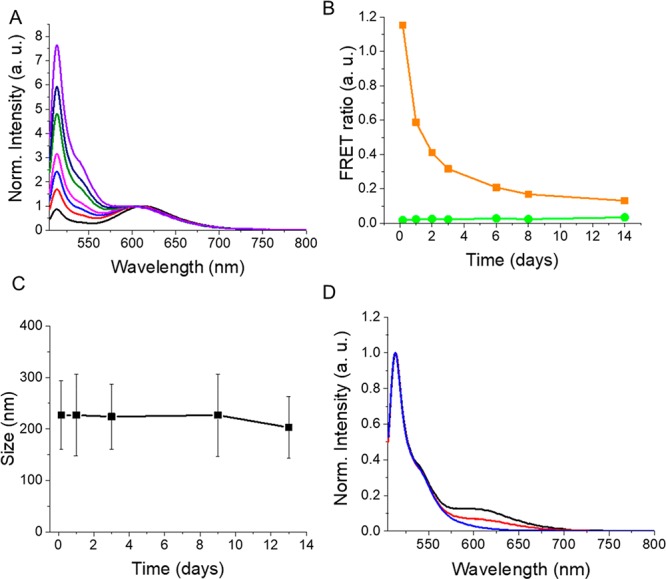
Figure 3.

Stability assessment of PLGA NPs in situ. (A) Fluorescence emission spectra of FRET NPs normalized at the acceptor emission peak measured at 4 h (black), day 1 (red), day 2 (blue), day 3 (magenta), day 6 (green), day 8 (navy), and day 14 (purple). Excitation wavelength: 488 nm. (B) FRET ratio plot for FRET NPs (orange) and green NPs (green) at different measurement time points. (C) Average particle size of FRET NPs measured at different incubation times. (D) Normalized emission spectra of FRET NPs (black), green NPs (blue), and disassembled FRET NPs (red) on day 14.
