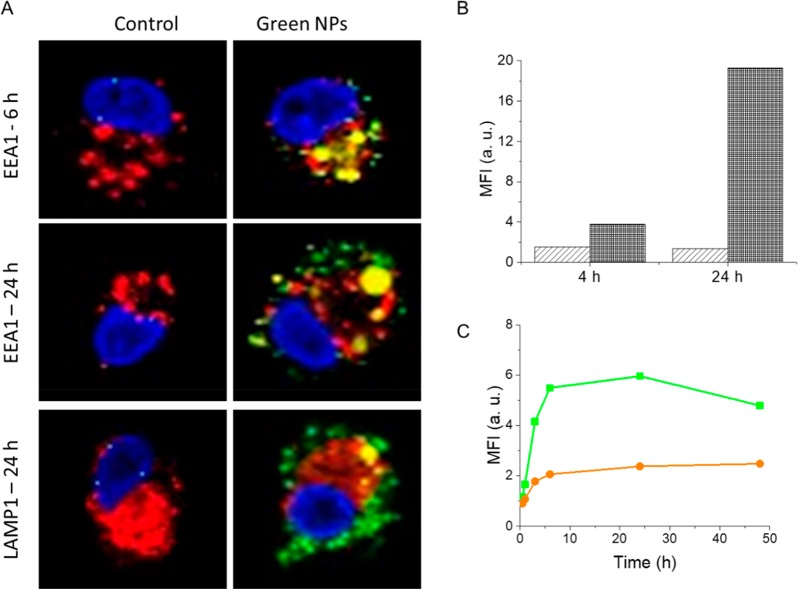
Figure 5.
(A) Confocal microscopy images of moDCs incubated with green NPs for 6 and 24 h. Cells were stained with DAPI for nuclei (blue) and either with EEA1 for early endosomes or with LAMP1 for lysosomes (red). The fluorescence emission of green NPs is presented in green. The overlap between green NPs and EEA1 or LAMP1 is shown in yellow. (B) Mean fluorescence intensity values obtained with flow cytometry at 4 and 24 h for moDCs incubated at 4 °C (light gray) and 37 °C (dark gray) with green NPs. (C) Mean fluorescence intensity plot for moDCs incubated with green NPs (green) and FRET NPs (orange) for various time points up to 48 h.

