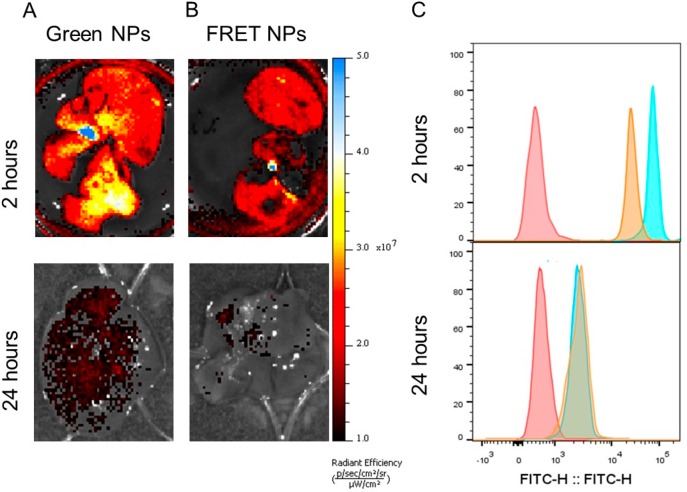
Figure 7.
Ex vivo imaging of the liver 2 and 24 h after i.v. injection of (A) Green NPs and (B) FRET NPs. (Excitation wavelength = 465 nm, emission filter = GFP, exposure time = 5 s.) (C) Flow cytometry histograms of cells isolated from the liver at 2 and 24 h postinjection. (Excitation wavelength = 488 nm, detection filter = FITC). Red: unlabeled control. Green: Green NPs. Orange: FRET NPs.

