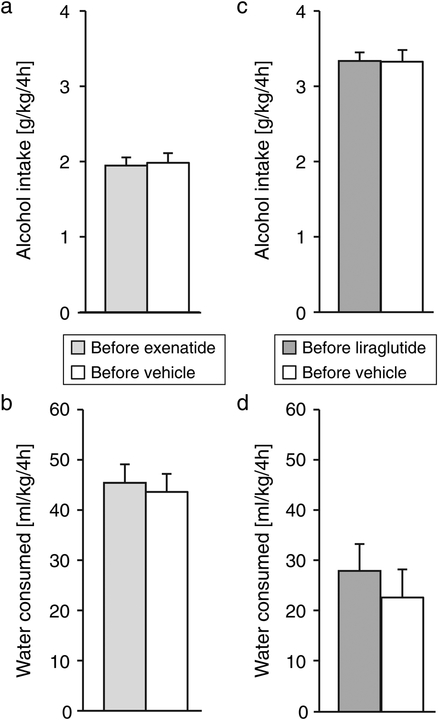
Fig. 2. Intake of alcohol and water at baseline.
Daily alcohol and water intake averaged over the baseline assessment period for the exenatide study (a,b) and the liraglutide study (c,d). Ordinates: alcohol intake in g/kg/4h (top), water intake in ml/kg/4h (bottom). Data are group means, bars represent s.e.m. n=12, except for the exenatide group, n=11.

