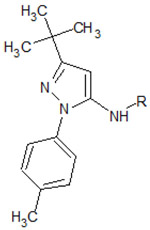
Table 1.
Structures of the 11 reference ligands published by Schneider et al.,[22] and their corresponding available PDB IDs, experimental free energies (ΔGexp), and the length of MD simulations.
 | ||||
|---|---|---|---|---|
| R= | PDB ID |
ΔGexp (Kcal/mol) |
MD (ns) |
|
| 1 |  |
4F6W | −10.324 | 500 |
| 2 |  |
4F7L | −10.979 | 500 |
| 3 |  |
4F7J | −7.184 | |
| 4 |  |
4F70 | −7.877 | |
| 5 |  |
4F6U | −8.447 | 500 |
| 6 | H | No bind | ||
| 7 |  |
4F6S | −7.533 | |
| 8 |  |
−7.965 | ||
| 9 |  |
−7.482 | ||
| 10 |  |
−8.078 | 500 | |
| 11 | 4F7N | −9.739 | 500 | |
