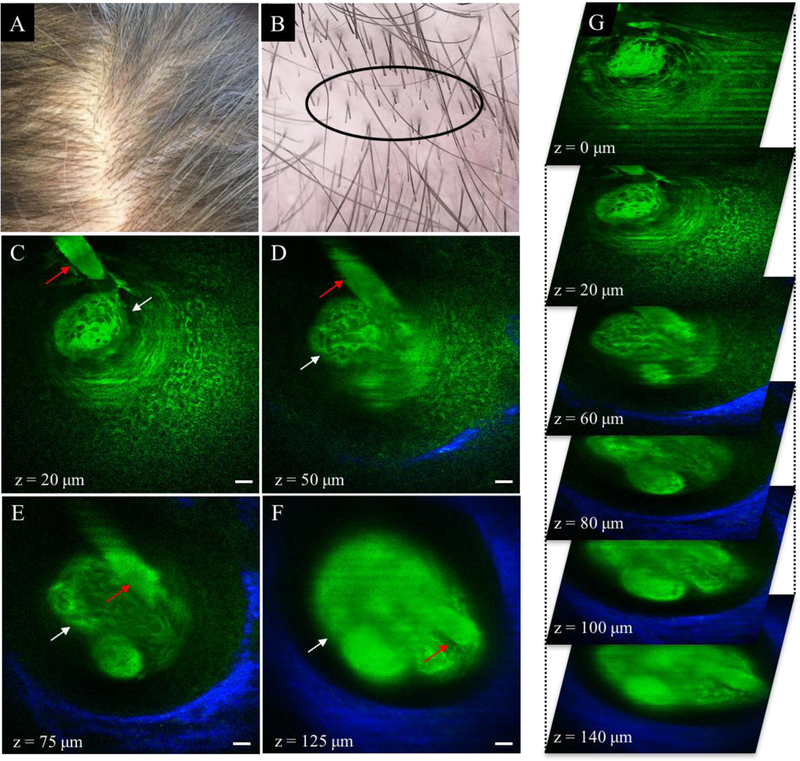
Figure 2.

Normal scalp (Savin I). (A) Clinical image of frontoparietal scalp area. (B) Dermoscopic image of frontoparietal scalp area. Hair was clipped in the imaged area (black ellipse). (C-F) MPM images acquired at different depths showing a hair shaft (red arrow) in the vicinity of a sebaceous gland (white arrow). The collagen fibers surrounding the hair follicle are visualized through the SHG signal (blue in D-F). Scale bar is 20 μm. (G) A 3D view of MPM images in a z-stack from which the (C-F) images were selected.
