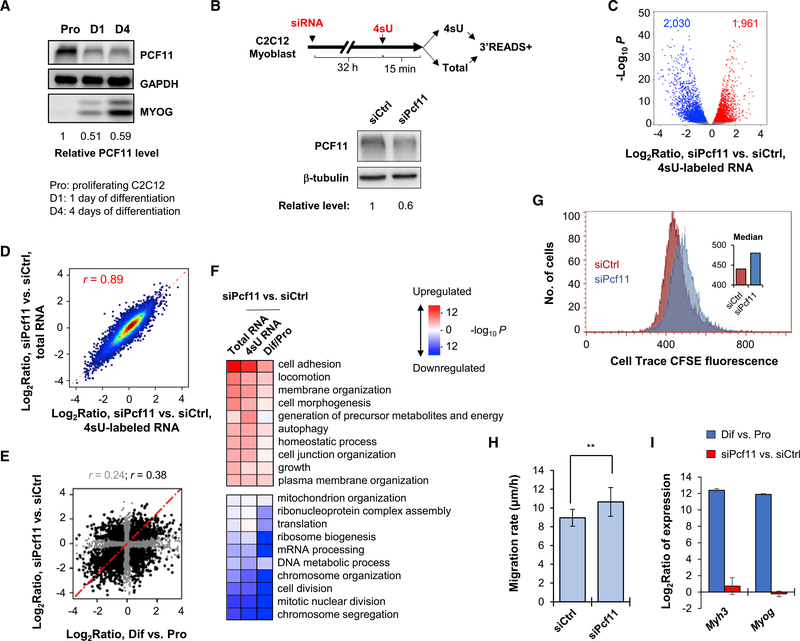
Figure 1. PCF11 Regulates Gene Expression Related to Cell Differentiation.
(A) Western blot analysis of PCF11 expression during C2C12 cell differentiation. Relative levels are based on normalization to GAPDH. MYOG level indicates stage of differentiation.
(B) Top: schematic of experimental design. Bottom: KD efficiency after 32 h of siRNA treatment.
(C) Volcano plot showing expression changes (4sU RNA data only) in siPcf11 versus siCtrl. Significantly regulated genes (fold change > 1.2 and p < 0.05, DESeq analysis) are marked. Gene numbers are indicated.
(D) Scatterplot comparing gene expression changes in 4sU versus total RNA samples. Pearson correlation coefficient (r) is indicated.
(E) Scatterplot comparing gene expression changes in Pcf11 KD cells versus C2C12 differentiation. Pearson correlation coefficient (r) is indicated (gray for all genes, black for significantly regulated genes in either condition). Pro, proliferating cells; Dif, differentiating cells (after 4 days).
(F) Heatmap showing top Gene Ontology (GO) terms associated with regulated genes in Pcf11 KD cells and C2C12 differentiation. Colors represent significance and direction of regulation as indicated.
(G) Cell proliferation of siPcf11 and siCtrl cells as measured using a CFSE assay.
(H) Cell migration analysis of siPcf11 and siCtrl cells by a scratch assay. Error bars are SEM on the basis of ten analyzed regions. **p < 0.05 (t test).
(I) Expression changes of two muscle cell differentiation marker genes, Myh3 and Myog, on the basis of 3′READS data. Error bars are SD.

