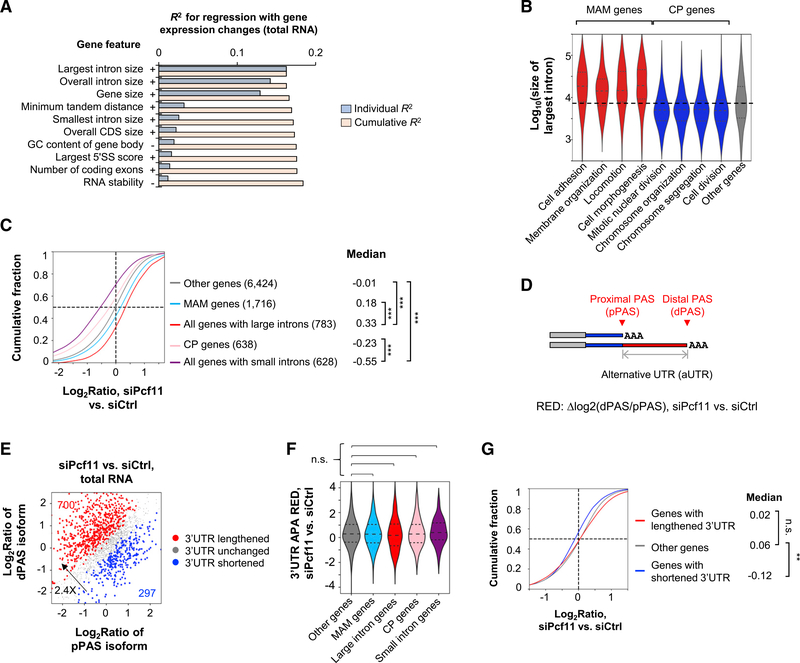
Figure 2. PCF11 Regulates Gene Expression through Gene Size.
(A) Top features on the basis of regression analysis of gene features versus gene expression changes in siPcf11 versus siCtrl samples (total RNA). Features are sorted according to individual R2 value. Cumulative R2 value is based on a given feature together with all other features with a better individual R2 value. + and − denote positive and negative correlations, respectively.
(B) The largest intron size of genes in different GO term gene groups. MAM (morphology, adhesion, and migration) and CP (cell proliferation) groups are indicated.
(C) Gene expression changes of different gene groups in siPcf11 versus siCtrl samples. MAM and CP groups correspond to those in (B), respectively. Gene number is indicated in parenthesis, and median value is shown. ***p < 0.001 (K-S test).
(D) Schematic of 3′UTR APA analysis. RED, relative expression difference (pPAS versus dPAS in KD versus control samples).
(E) 3′UTR APA changes in Pcf11 KD cells (total RNA samples). The numbers of genes with significantly lengthened 3′UTRs (red) or shortened 3′UTRs (blue) are indicated.
(F) 3′UTR APA RED of different gene groups in (C). n.s., not significant (K-S test).
(G) Expression changes of genes with different types of 3′UTR regulation in (E). **p < 0.01 (K-S test).

