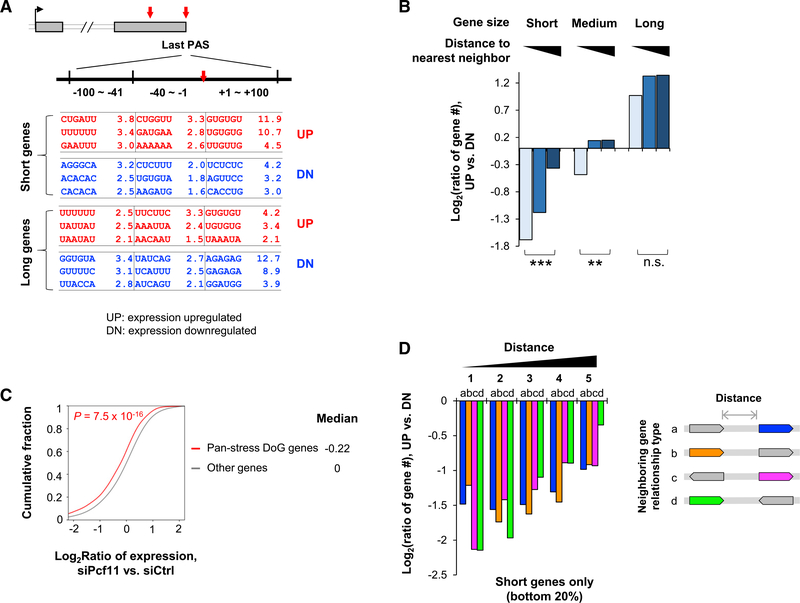
Figure 3. Short Genes Depend on PCF11 for Expression.
(A) Enriched motifs around the last PAS of up- or downregulated genes (UP and DN, respectively) in short and long gene groups. Three sub-regions are analyzed, as indicated.
(B) Gene number ratio of upregulated genes to downregulated genes in different gene groups on the basis of gene size and distance to the nearest neighbor. **p < 0.01, ***p < 0.001, and n.s., not significant (Fisher’s exact test).
(C) Pan-stress readthrough genes (pan-stress DoG genes) tend to be downregulated in Pcf11 KD cells. The number of pan-stress DoG genes is indicated. p value is based on K-S test.
(D) Gene number ratio of upregulated genes to downregulated genes in five gene groups on the basis of distance to neighbor. There are four types of relationship between the analyzed gene (colored) and its neighbor, on the basis of relative transcriptional orientation (shown on the right, with arrows indicating direction of transcription). Only short genes are used for analysis.

