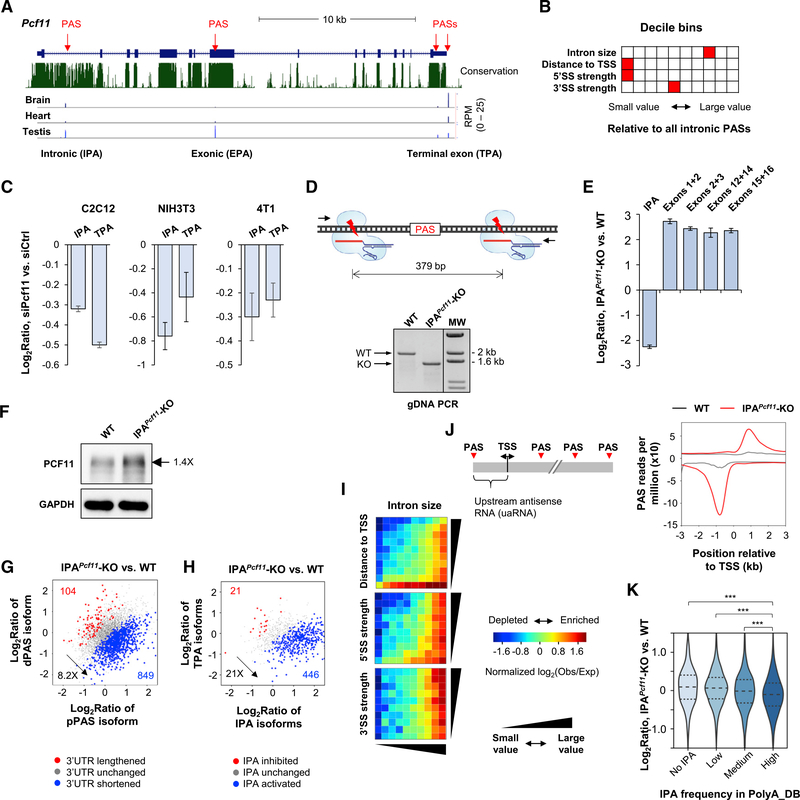
Figure 6. Pcf11 Expression Is Regulated by IPA.
(A) Schematic of mouse Pcf11 gene. Multiple PASs are indicated. EPA, internal exonic polyadenylation; IPA, intronic polyadenylation; TPA, 3′ terminal exon polyadenylation. 3′READS data of brain, heart, and testis are shown.
(B) Features of intron 1 compared with other introns in the mouse genome. Each feature has ten bins, and the bin containing intron 1 of Pcf11 is highlighted in red. Distance to TSS is based on all IPA sites in PolyA_DB.
(C) RT-qPCR analysis of IPA and TPA isoform expression in siPcf11 versus siCtrl cells. Error bars are SD on the basis of three replicates.
(D) Top: schematic showing two sgRNAs used to remove a region flanking the IPA site. Bottom: validation of IPA site knockout (IPAPcf11-KO) by genomic DNA PCR using primers flanking the KO region. WT, wild-type 4T1 cells.
(E) RT-qPCR analysis of Pcf11 isoform expression in WT and IPAPcf11-KO cells. Error bars are SD on the basis of three replicates.
(F) Western blot analysis of PCF11 in WT and IPAPcf11-KO cells.
(G) 3′UTR APA changes in IPAPcf11-KO cells.
(H) IPA changes in IPAPcf11-KO cells. IPA isoforms (all combined) were compared with TPA isoforms (all combined) in analysis.
(I) IPA distribution maps of activated IPA events in IPAPcf11-KO cells.
(J) Left: schematic of PASs around the transcription start site (TSS); right: metagene analysis of PAS usage around the TSS in WT and IPAPcf11-KO cells.
(K) Gene expression changes in IPAPcf11-KO cells for different groups of genes on the basis of IPA site frequency in PolyA_DB. ***p < 0.01 (K-S test).

