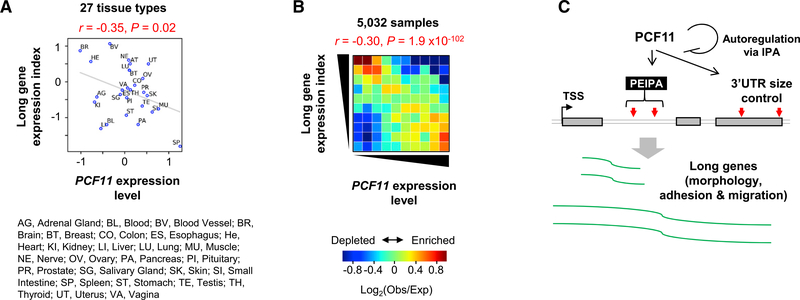
Figure 7. Global Analysis of PCF11 Expression versus Long Gene Expression across Human Tissues.
(A) Scatterplot showing correlation between long gene expression and PCF11 expression in 27 human tissues on the basis of GTEx data. Pearson correlation coefficient (r) and its p value are shown.
(B) Heatmap showing correlation between long gene expression and PCF11 expression on the basis of 5,032 GTEx samples. Obs, observed number of samples; Exp, expected number of samples based on the average of all samples.
(C) A model summarizing PCF11-mediated gene expression regulation through IPA (PEIPA).

