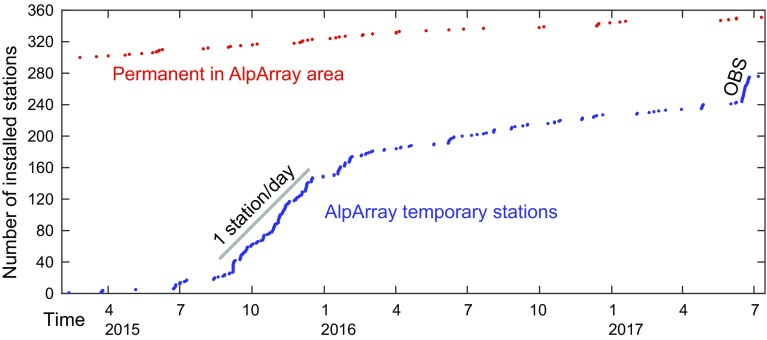
Fig. 5.
Development of AASN broadband seismological stations in the AlpArray area. Each point represents one station. Time is in month (above) and year (below) units. During the peak of the installation phase in autumn 2015, more than 1 station per day was installed. Only the ocean-bottom sensor (OBS) deployment rate was higher

