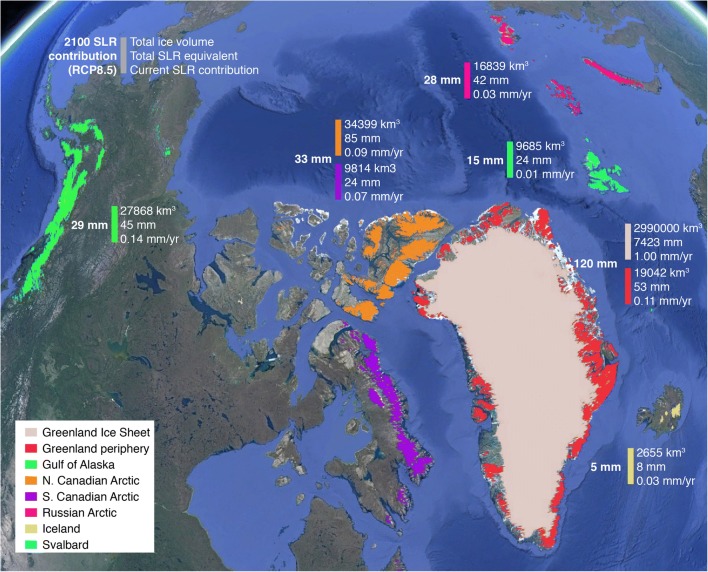
Fig. 1.
Location of Greenland and Arctic land ice. Values shown for total ice volume (km3), equivalent sea level rise potential (mm), current (2003–2009) sea level rise contribution (mm/year), and projected contribution to sea level rise during 2006–2100 (mm) for the RCP8.5 emissions scenario [1••, 4••, 35, 47•, 63]

