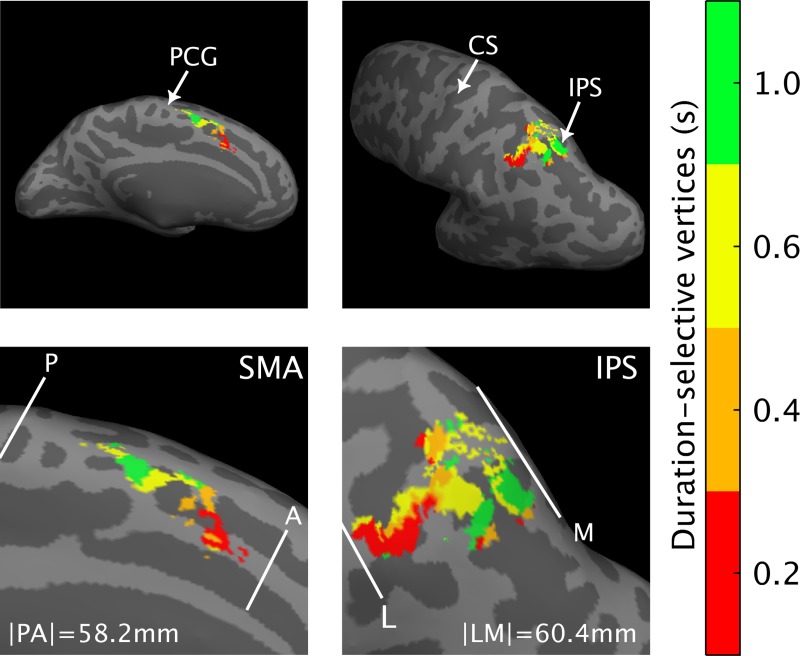
Fig 2. Group-level fMRI results of Exp 1.
M and L view of the left hemisphere, with the group-level statistical results (N = 11) overlaid on the inflated Dartel-11 template. The figure shows the cluster of vertices (i.e., voxels projected onto the brain surface) classified according to a winner-take-all procedure based on statistical t-maps, as maximally responsive to each of the four S1 durations (0.2, 0.4, 0.6, and 1 s). Each color codes a different label; the color scale goes from red (shortest S1) to green (longest S1). Statistical threshold for t-maps was set to PFWE < 0.05 cluster-level corrected for multiple comparisons across the whole brain. Duration-selective vertices were found in SMA (leftward panel) but also in the IPS. The durations of the color bar are red = 0.2, orange = 0.4, yellow = 0.6, and green = 1 s. The white lines give an example of the map borders, as they were drawn to estimate the wRD from either the P or the L border in individual subjects. For the wRD computation, though, borders were drawn in each individual subject in their native space. The size of the maps reported in the figure is the average size calculated across the 11 subjects when their map was in a common Dartel space. The data can be found in S2 Data. A, anterior; CS, central sulcus; fMRI, functional magnetic resonance imaging; FWE, familywise error; IPS, intraparietal sulcus; L, lateral; M, medial; P, posterior; PCG, precentral gyrus; S1, first stimulus; SMA, supplementary motor area; wRD, weighted relative distance.

