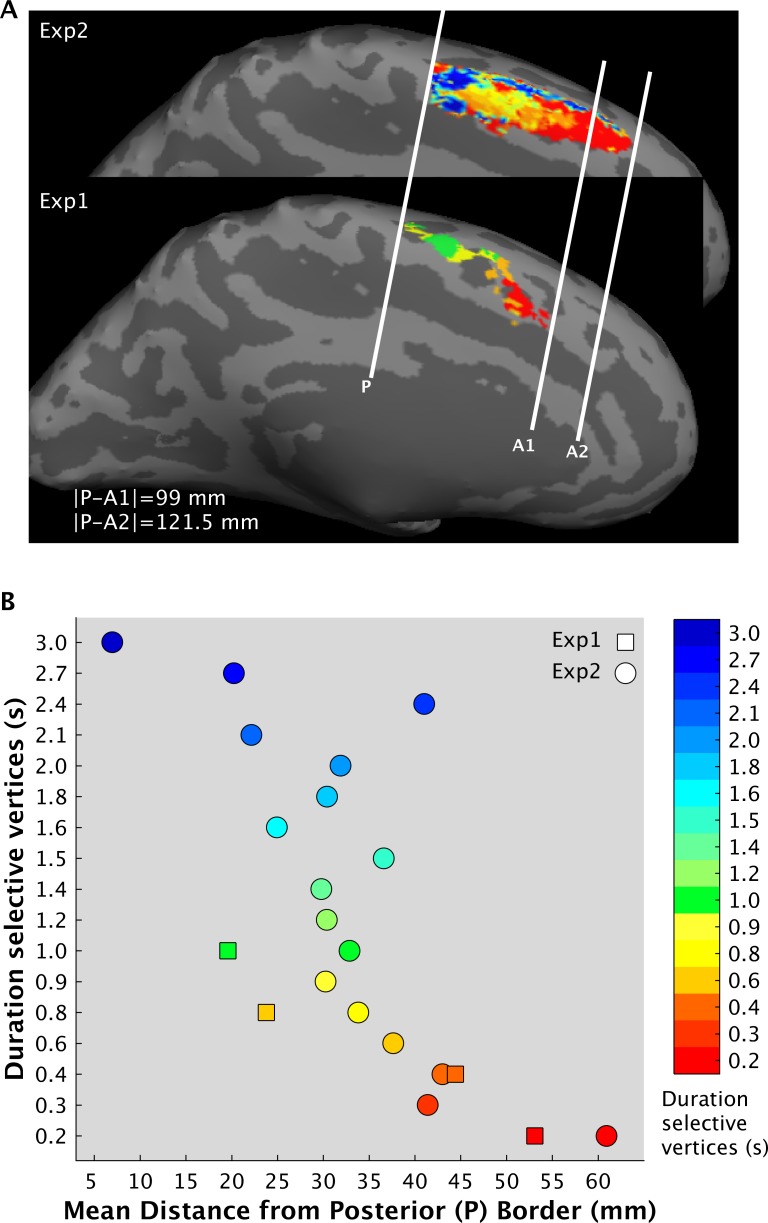
Fig 11. fMRI results, comparison between the chronotopic maps of the two experiments.
(A) Chronotopic maps in the left SMA in the two experiments; group-level maps are superimposed on an inflated Dartel template computed on the high-resolution anatomical images of the 21 subjects. White lines are the borders of the maps. The posterior border lies on the most posterior part of the PCG. (B) For each experiment (squares are Exp 1 and circles Exp 2) and for each duration-selective clusters of vertices, we estimated the centroids and then calculated their absolute distance from the posterior border. The data can be found in S1 Data. fMRI, functional magnetic resonance imaging; PCG, precental gyrus; SMA, supplementary motor area.

