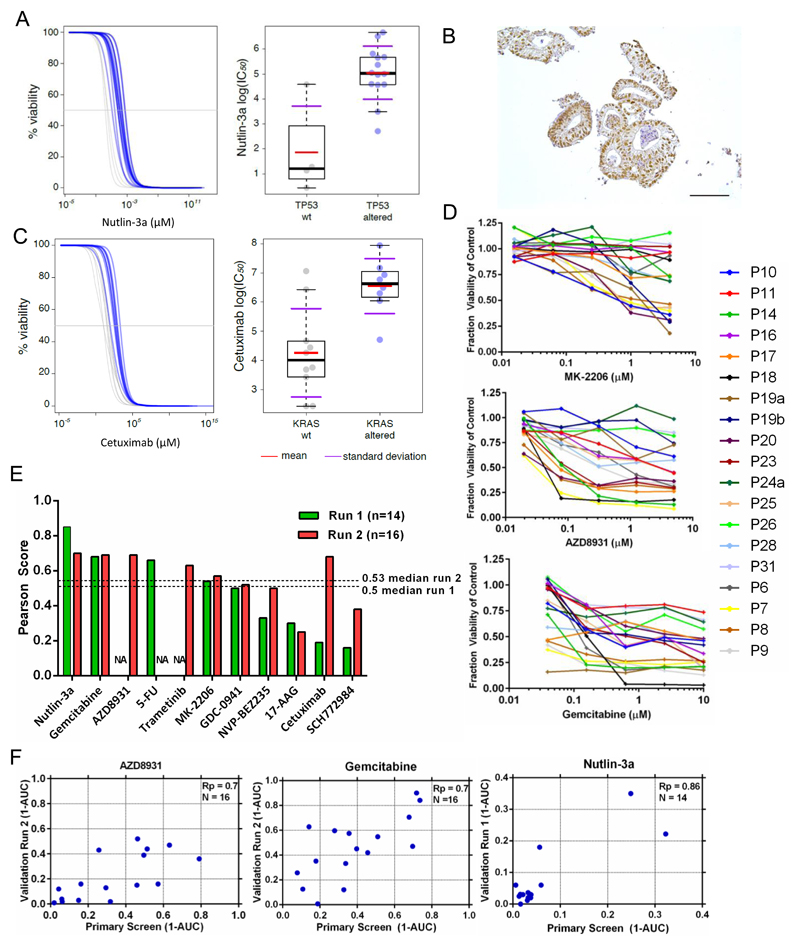
Figure 7. Gene-drug associations and differential drug sensitivity profiles of interest.
(A) Association of TP53 mutational status with nutlin-3a response. Viability response curves of the altered (blue) and wild-type organoids (grey) as well as scatter plots of cell line IC50 (μM) values. IC50 values are on a log scale comparing TP53 mutant and wild type (WT) cell lines. Each circle represents the IC50 of one cell line and the red bar is the geometric mean.
(B) Immunohistochemical staining showing stabilization of TP53 in organoid P18 (Scale bar = 100 μM).
(C) Association of KRAS status and cetuximab response.
(D) Dose-response curves after 6 days treatment with MK2206, AZD8931 and gemcitabine. Error bars are the standard deviation of triplicate measurements.
(E) Reproducibility of drug response profiles for 11 drugs. The Pearson correlation score of (1-AUC) values from the primary screen compared to (1-AUC) values from validation screens are used for comparison. The validation screen was performed twice (run 1 and 2) with >1 month elapsed between each screen. NA - data unavailable for this drug.
(F) The correlation of 1-AUC values from the primary and validation screens for AZD8931, gemcitabine and nutlin-3a.

