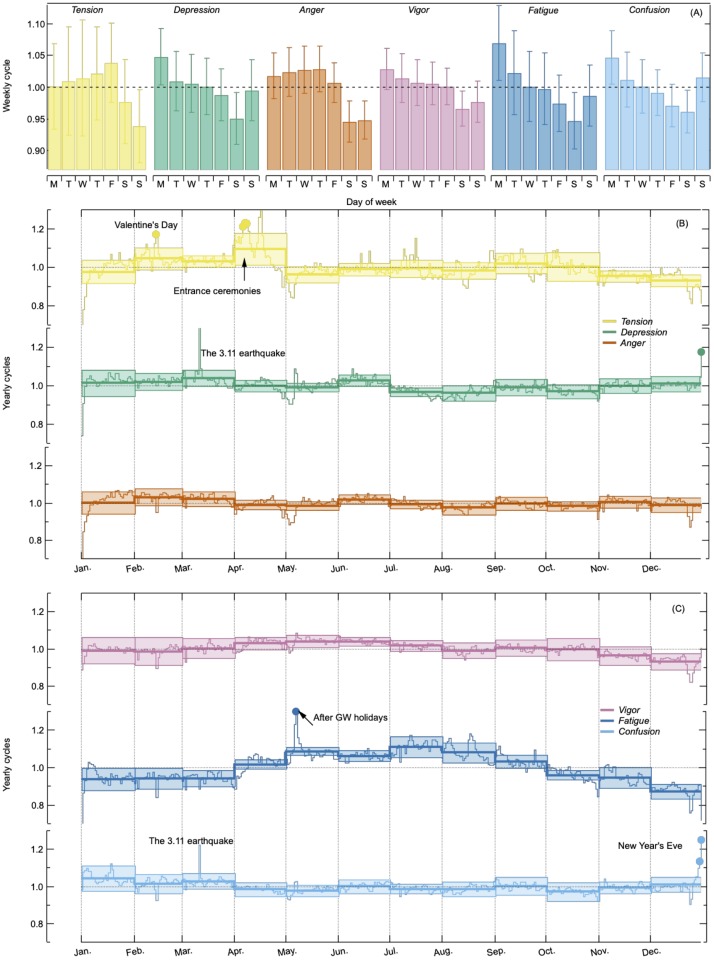
Fig 2. Weekly and yearly periodicities p(l).
(A) Weekly periodicities p(l) for each of the emotional dynamics with error bars representing standard deviations, s(l), over 520 weeks. Most emotions show differences between weekdays and weekends. (B)(C) Yearly periodicities p(l) for each of the emotional dynamics in monthly scale (bold) and in daily scale (dotted) with shaded area representing standard deviations s(l) for nine years. Fatigue increases during summer times (July and August) while Depression and Confusion slightly increases during winter times (December and January).

