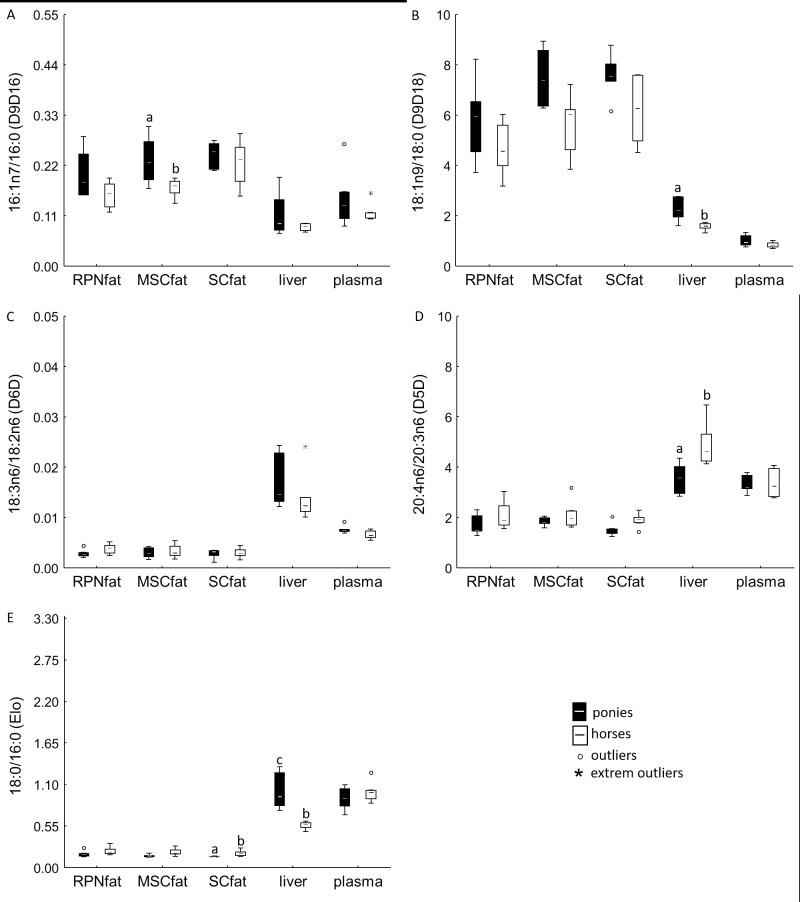
Fig 1. Calculated Desaturase and Elongase Activity Indices.
Product/precursor ratio of the percentages of individual FAs represent desaturase and elongase activity indices: (A) C16:1n-7/C16:0 = Δ9-desaturase (D9D16), (B) C18:1n-9/C18:0 = Δ9-desaturase (D9D18), (C) 18:3n-6/C18:2n-6 = Δ6-desaturase (D6D), (D) C20:4n-6/C20:3n-6 = Δ5-desaturase (D5D) and (E) C18:0/C16:0 = elongase (Elo). Data are shown as whisker plots. Boxes represent the interquartile range (IQR) between the 25th and 75th percentiles. Horizontal lines are medians. Error bars show the full range excluding outliers (dots), which are defined as being more than 1.5 IQR outside the box. Lower-case superscripts with different letters indicate significant differences in these values between equine species (P ≤ 0.05).

