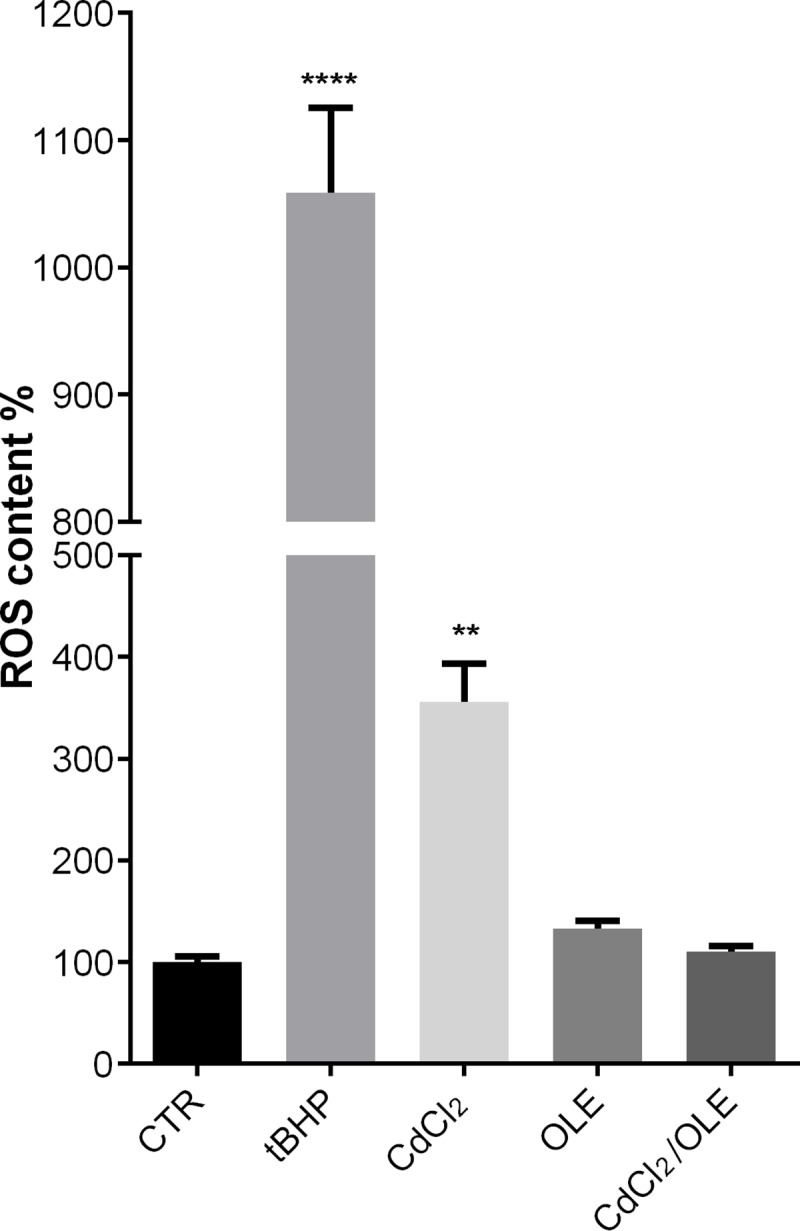
Fig 9. ROS content.

ROS content was measured using dihydrorhodamine-123 fluorescence in MCD4 cells treated as described in Methods. As positive control, cells were treated with tBHP. Data are shown as mean ± SEMs and analyzed by one-way ANOVA followed using Tukey’s Multiple Comparison test. (**P<0.01 vs CTR; ****P<0.0001 vs CTR).
