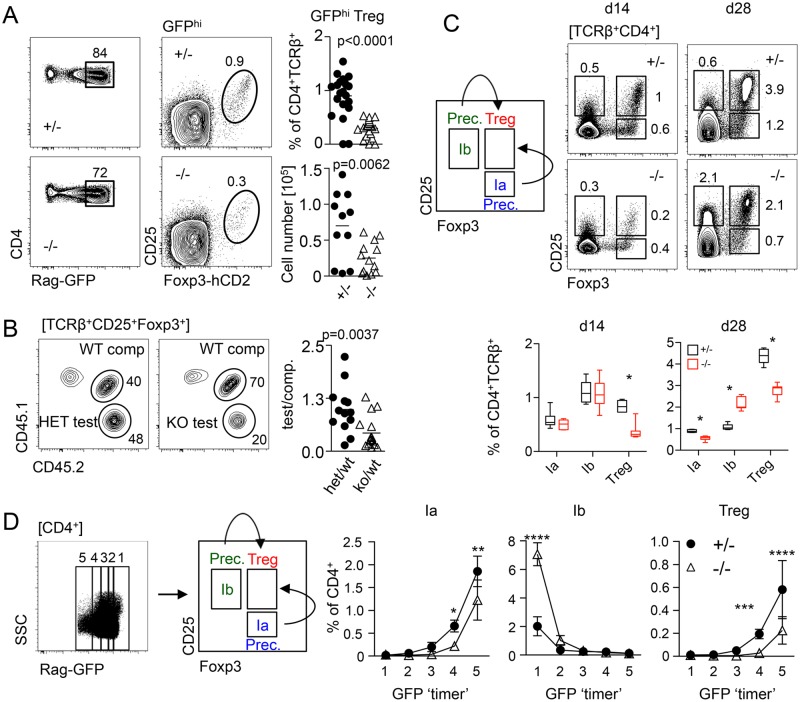
Fig 1. miR-181a/b-1 control intrathymic development of Treg cells.
(A) Representative plots, frequencies, and absolute numbers of TCRβ+CD4+RagGFPhi Treg cells in miR-181–sufficient and deficient mice. Data from 5 independent experiments; each data point represents one mouse. (B) Competitive BM chimeras. BM cells from miR-181a/b-1+/− (het) or miR-181a/b-1−/− (KO) mice (both CD45.2) were mixed in a 1:1 ratio with competitor WT BM cells (CD45.1/2) and injected into lethally irradiated WT recipients (CD45.1). Chimeras were analyzed 12 weeks later for the generation of TCRβ+CD4+Foxp3+ cells in the thymus. Plots are representative of 2 independent experiments with n = 8 for each genotype. Graph shows ratio of TCRβ+CD4+Foxp3+ cells within test versus competitor populations. Each data point represents an individual mouse. (C) Frequencies of tTreg cells (TCRβ+CD4+CD25+Foxp3+) and their precs TCRβ+CD4+CD25−Foxp3+ (Ia) and TCRβ+CD4+CD25+Foxp3− (Ib) on d 14 and 28 after initial induction of Rag1 expression in InduRag1 mice sufficient and deficient for miR-181a/b-1. Depicted data are from 2 independent experiments, with n = 1–4 for each genotype and time point analyzed. Below, quantification of the experiment presented in (C). (D) Molecular age of miR-181a/b-1 Treg cells and their precs assessed using Rag1GFP reporter mice. Representative plot and gating strategy (left) and quantification (right). Data from 2 independent experiments, n = 3–4 for each genotype. Statistical analysis was performed using unpaired Student’s t test (A, B), multiple t test (C), and two-way ANOVA (D, p-values for effect of genotype, **p = 0.0021, ***p = 0.0002 and ****p < 0.001). Numerical values are available in S1 Data. BM, bone marrow; CD, cluster of differentiation; d, day; Foxp3, forkhead box protein P3; GFP, green fluorescent protein; hCD2, human CD 2; InduRag1, inducible recombination-activating gene 1; KO, knockout; miR-181, microRNA-181; prec, precursor; Rag1, recombination-activating gene 1; TCR, T-cell receptor; Treg cell, regulatory T cell; tTreg cell, thymic Treg cell; WT, wild type.

