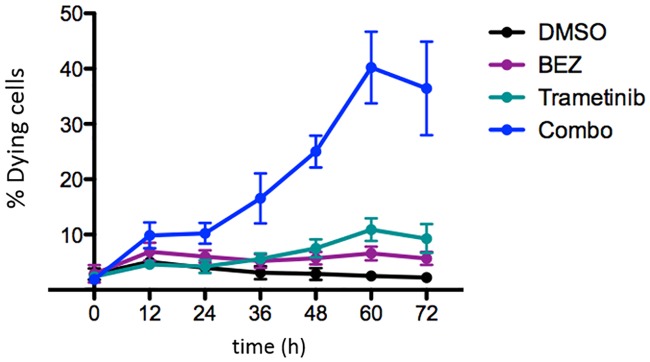
Fig 6. Death time series data for model training.
The YO-PRO-1 dye was used to quantify the proportion of dying cells every 12h in response to drug treatment [18]. The cells were treated with DMSO (baseline), 1μM Trametinib, 1μM BEZ235, or the combination of 1μM Trametinib + 1μM BEZ235.

