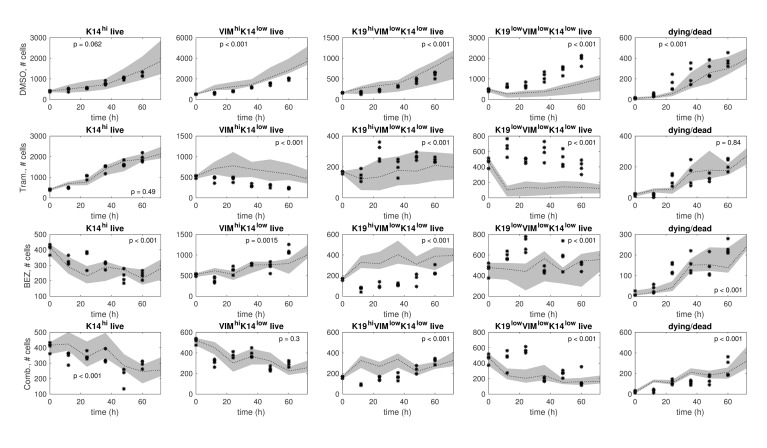
Fig 8. Ensemble model predictions in comparison to test data.
The test samples (black stars) and ensemble model predictions (gray bands) are shown for each treatment condition: DMSO (row 1), Trametinib (row 2), BEZ235 (row 3), and Trametinib+BEZ235 (row 4). The model ensemble is a collection of models that were identified from the training data via resampling residuals bootstrap [30] for each treatment condition. In each plot, we show a 95% confidence interval (gray band) around the median (black dotted line) of the ensemble model predictions. Higher p-values indicate better consistency between predictions and test data over the time horizon (12h, 24h, …, 60h).

