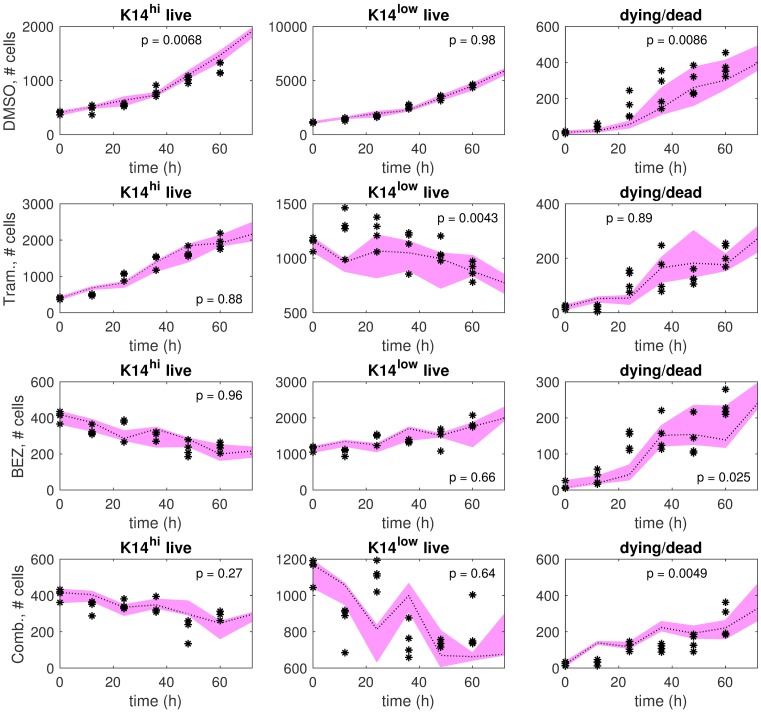
Fig 9. Single model predictions in comparison to test data, where the differentiation states are defined by K14 only.
The test samples (black stars) and single model predictions (pink bands) are shown for each treatment condition: DMSO (row 1), Trametinib (row 2), BEZ235 (row 3), and Trametinib+BEZ235 (row 4). The single model was identified on the training data using K14hi and K14low as the differentiation states for each treatment condition. The pink band extends between the maximum prediction and the minimum prediction out of four predictions in total at each time point (0h, 12h, …, 72h). The dotted line indicates the median of the predictions. Higher p-values indicate better consistency between predictions and test data over the time horizon (12h, 24h, …, 60h).

