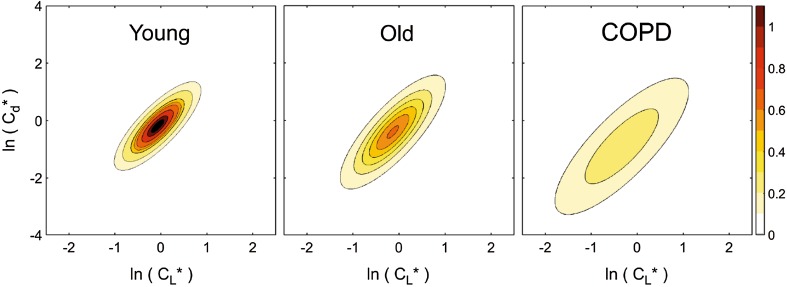
Fig. 3.
Contour plots for the bivariate log normal distributions for (standardized) compliance and conductance for three participant groups: young, old, and COPD. Contour intervals are values for the probability density function. The increased lung inhomogeneity for COPD cohort is readily apparent from the widths of the distribution. Further details can be found in Mountain et al. [44]

