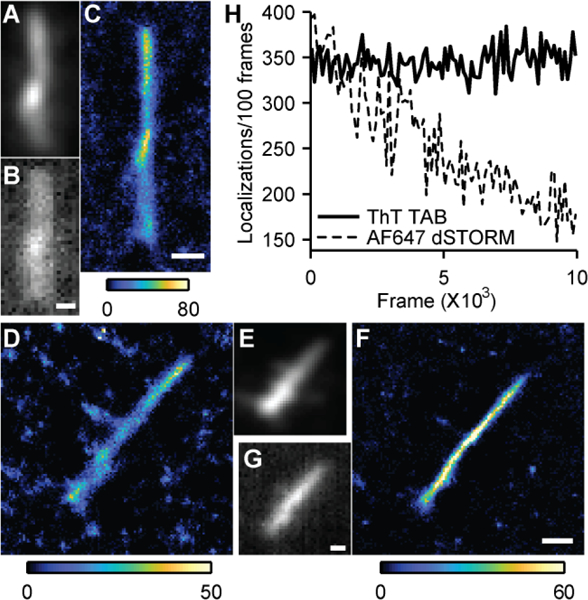
Figure 2.

TAB SR imaging compared to conventional labelling. (A) Diffraction-limited image of an intrinsically-labeled Aβ42 fibril (4.2 % Aβ42-Alexa 647). (B) Diffraction-limited ThT image of the fibril in A. (C) TAB SR image of the fibril in A. (D) Conventional SR image of an Aβ42 fibril using Alexa-647 antibody staining. (E) Diffraction-limited image of D using Alexa-647. (F) TAB SR image of D. (G) Diffraction-limited ThT image of D. Color bars: localizations/bin. Scale bars: 300 nm. (H) Localizations per 100 frames over time for TAB and dSTORM imaging.
