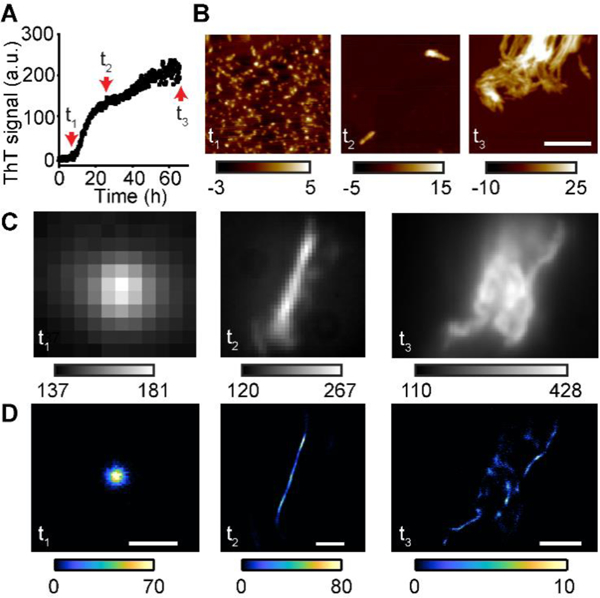
Figure 3.

Visualization of Aβ40 structures at various aggregation stages. (A) Aggregation kinetics of Aβ40 measured by ThT fluorescence. t1 (8 h), t2 (24 h), and t3 (66 h) represent oligomers, early fibrils and late fibril clusters, respectively. (B) AFM images of Aβ40 at t1, t2, and t3. Color bar in nm. Scale bars: 350 nm. (C) Diffraction-limited images of Aβ40 aggregates using ThT fluorescence at t1, t2, and t3. (D) TAB SR images of the structures in C. Fluorescence from out-of-focus structures decreased localizations in t3. Scale bars for t1, t2, and t3 are 0.5, 1, and 2.5 μm, respectively.
