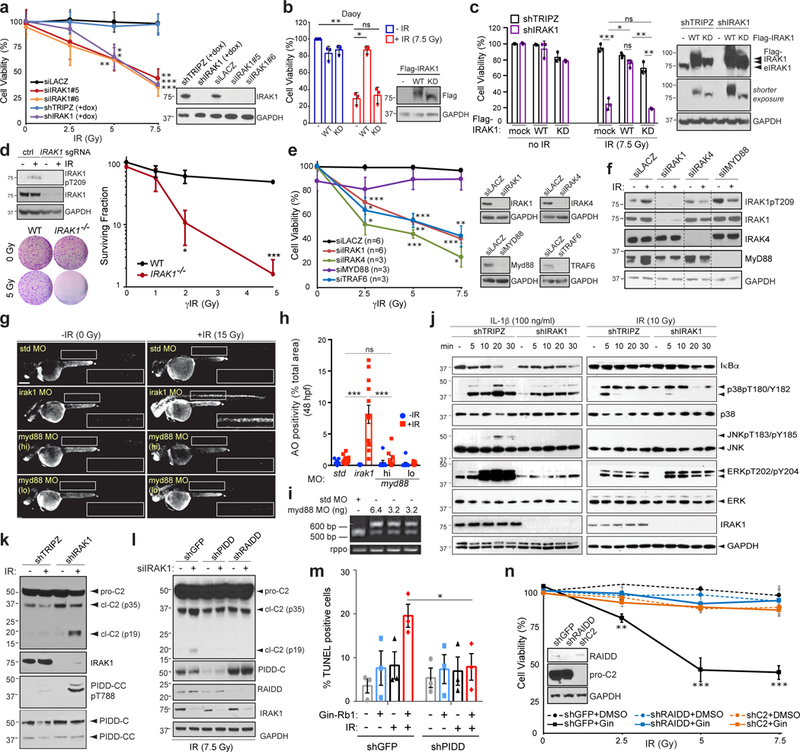
Fig. 4. IRAK1 acts independently of MyD88 and counters PIDDosome signalling.

(a-f, j-n) HeLa (a,d-f,j-n), Daoy (b) and CAL27 (c) cells transfected with indicated siRNA (a,e-f), WT or kinase dead (KD) Flag-IRAK1 (b-c), IRAK1 sgRNA plus Cas9 plasmid (d), and/or stably expressing indicated dox-inducible shRNA (a,c,k) or non-inducible shRNA (l-n), and/or treated with IRAK1 inhibitor Gin-Rb1 (10 μg/ml) (m,n) were analyzed 5 days post IR (dpIR, IR doses in Gy) by alamarBlue cell viability assay (a-c,e,n), 14 dpIR by clonogenic assay (d), 2dpIR by TUNEL assay (m), and/or by western blot with indicated antibodies (a-f, j-l) at indicated minutes post-IR or interleukin 1β (IL-1β) treatment (j) or 24 hpIR (a-f, k-l, n). eIRAK1 (in c), endogenous IRAK1. In (k-l, n), pro-C2, procaspase-2; cl-C2 (p35), intermediate cleavage product; cl-C2 (p19), mature cleavage product. Data in a-e and m-n represent means +/− SD, n = 3 independent experiments performed in triplicates. In j, activation of the following pathways marked by: gradual decline in IκB levels (NF-κB); p38 T180/Y182 phosphorylation (p38/MAPK); JNK T183/Y185 phosphorylation (JNK); ERK T202/Y204 phosphorylation (ERK). (g-h) Representative images (as in 3b for std and irak1 MOs) and quantification of p53MK/MK embryos injected with indicated MOs and treated with or without 15 Gy IR at 18 hpf (blue and red bars in h, respectively) analyzed in AO assay at 24 hpIR. Number of quantified spinal chord images (as boxed in g) from 4 independent experiments (bars 1–4) or 3 independent experiments (bars 5–8) were: std MO: n of non-irradiated = 9, n of irradiated = 11; irak1 MO: n of non-irradiated = 11, n of irradiated = 13; myd88 MO high (hi, 6.4 ng): n of non-irradiated = 7, n of irradiated = 8; myd88 MO low (lo, 3.2 ng): n of non-irradiated = 9, n of irradiated = 11. (i) RT-PCR of pooled embryo mRNA extracts shows MO dose-dependent intron retention in myd88 message. *P < 0.05, **P < 0.005, **P < 0.0005 throughout the figure, n.s., not significant, two-tailed Student’s t-test. See Supplementary Table 4 and Supplementary Fig. 8 for statistics source data including precise P values and unprocessed immunoblots, respectively. Scale bar, 0.2 mm.
