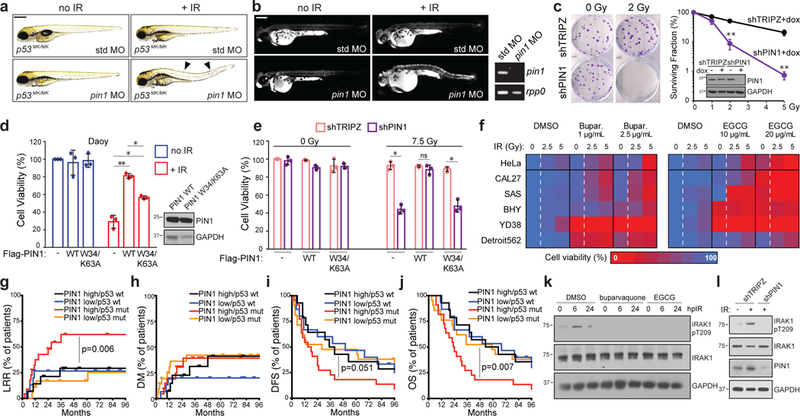
Fig. 6. PIN1 inhibition overcomes R-RT in zebrafish and human tumour-cell models while its overexpression associates with TP53 mutant HNSCC recurrence.

(a-b) MO depletion of Pin1 but not std MO restores DTCs (a) and AO uptake (b) after 15 Gy IR. See Supplementary Fig. 6c-d for quantifications. (b, right) RT-PCR of embryonic mRNA extracts detect nonsense mediated decay of pin1 mRNA. (c) Clonogenic assay of shTRIPZ and shPIN1 HeLa cells after up to 5 Gy IR. Surviving fractions to the right. Western blot showing PIN1 knockdown also shown. (d) Daoy cells transfected with mock, WT or catalytically inactive (W34/K63A) PIN1, exposed to 0 or 7.5 Gy IR and assayed by alamarBlue at 5dpIR. Western blot of Flag-PIN1 levels also shown. (e) shTRIPZ and shPIN1 CAL27 cells reconstituted with Flag-PIN1 constructs exposed to 0 or 7.5 Gy IR and assayed by alamarBlue at 5 dpIR. Data in (c-e) are means +/− SD of n = 3 independent experiments performed in triplicates. *P <0.05, **P <0.005, two-tailed Student’s t-test. (f) MTD and 2xMTD of buparvaquone and EGCG given to indicated cell lines with 0, 2.5 or 5 Gy IR and analyzed by alamarBlue in n = 3 independent experiments in triplicates. Color coding as in Fig. 5d. Corresponding survival curves including p-values shown in Supplementary Fig. 6n. (g-j) Kaplan-Meier curves showing LRR (locoregional recurrence, g), DM (distant metastases, h), DFS (disease-free survival, i) and OS (overall survival, j) in patients from the MDACC HNSCC cohort split at median PIN1 expression and analyzed by two sided log-rank test. All patients treated with complete surgical resection followed by post-operative RT. n of patients with: PIN1high/TP53 WT = 14; PIN1low/TP53 WT = 15; PIN1high/TP53 MUT = 22; PIN1low/TP53 MUT = 21. See Supplemental Table 3 for patient characteristics. (k-l) HeLa cells treated with buparvaquone (1μg/ml) or EGCG (10 μg/ml) (k) or stably expressing indicated shRNAs (l), treated with 0 or 10 Gy IR and analyzed by western blot at indicated hours post IR (hpIR). See Supplementary Table 4 and Supplementary Fig. 8 for statistics source data including precise P values and unprocessed immunoblots, respectively.
