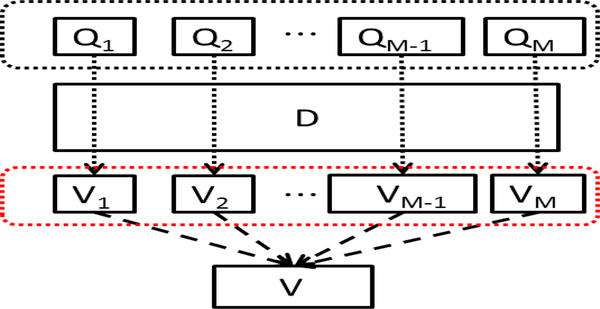
Fig. 3.
Voting map generation. In the black dashed rectangle, Q1, Q2,...,QM denote query images, D is a testing image. In the red dashed rectangle, V1, V2,...VM denote isolated voting-maps associated with each individual query image. A general voting-map V(T) is generated by summing all the isolated voting-maps.

