
Figure 2.
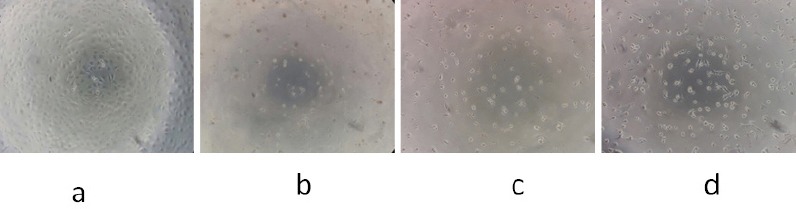
3T3 Cells (Normal Cells) were Treated with PNF. Description: a, control, 3T3 cells without treatment; b, 3T3 cellstreated with PNF at a concentrationof 500 µg/mL; c, 3T3 cellstreated with PNF at a concentration of 250 µg/mL; d, 3T3 cellstreated with PNF at a concentration of 125 µg/mL. 100× magnification.