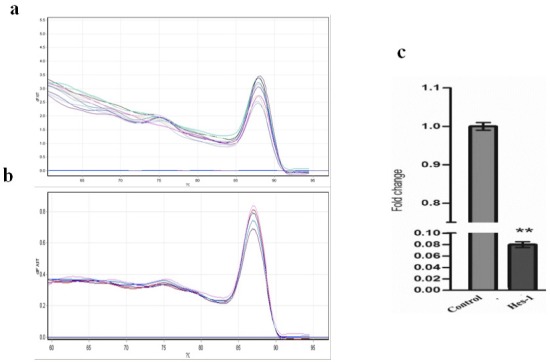
Figure 3.

Relative mRNA Expression was Measured by qRT-PCR Using 2 (− ΔΔCt) Method. (a and b) The melting curve of Hes-1 and beta actin primers during qRT-PCR process. (c) Determination of mRNA levels Hes-1 in OVCAR-3 Cells upon treatment with different concentration DAPT. The cells were treated with different concentration of DAPT. The results are expressed as mean ± SD values from at least 3 independent experiments (** p < 0.01).
