. 2019 Feb 25;8:e42786. doi: 10.7554/eLife.42786

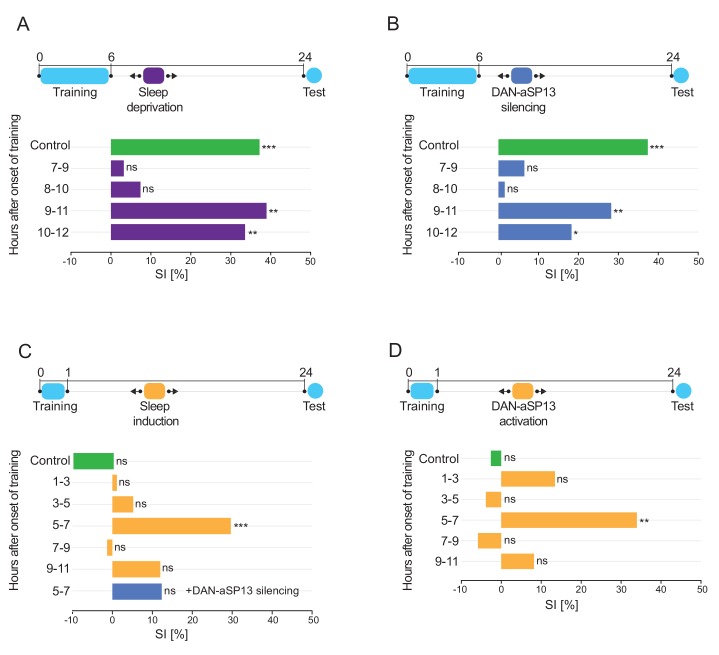
Figure 2. Sleep after learning is necessary and sufficient for LTM consolidation.

(A) SIs of the wild-type males tested 24 hr after training for 6 hr with a mated female and sleep deprived at indicated time periods after training (dark purple bars). SI of the wild-type control males that were allowed to sleep (green bar). P value is for Ho SI = 0; ***p<0.001, **p<0.01, ns p>0.05. Permutation test. (B) SIs of males after training for 6 hr with a mated female and DAN-aSP13s silenced with shits at indicated time periods (dark blue bars). SI of the control males with DAN-aSP13s active (green bar). P value is for Ho SI = 0; ***p<0.001, **p<0.01, *p<0.05, ns p>0.05. Permutation test. (C) SIs of males after training for 1 hr with a mated female and 104y neurons activated with csChrimson at indicated time periods (orange bars). SI of the control males with 104y neurons not activated (green bar). SI of the wild-type males with 104y neurons activated and DAN-aSP13s silenced between 5–7 hr after training (blue bar). P value is for Ho SI = 0; ***p<0.001, ns p>0.05. Permutation test. (D) SIs of males after training for 1 hr with a mated female and DAN-aSP13 neurons activated with csChrimson at indicated time periods (orange bars). SI of the control males with DAN-aSP13 not activated (green bar). P value is for Ho SI = 0; **p<0.01, ns p>0.05. Permutation test.

Figure 2.

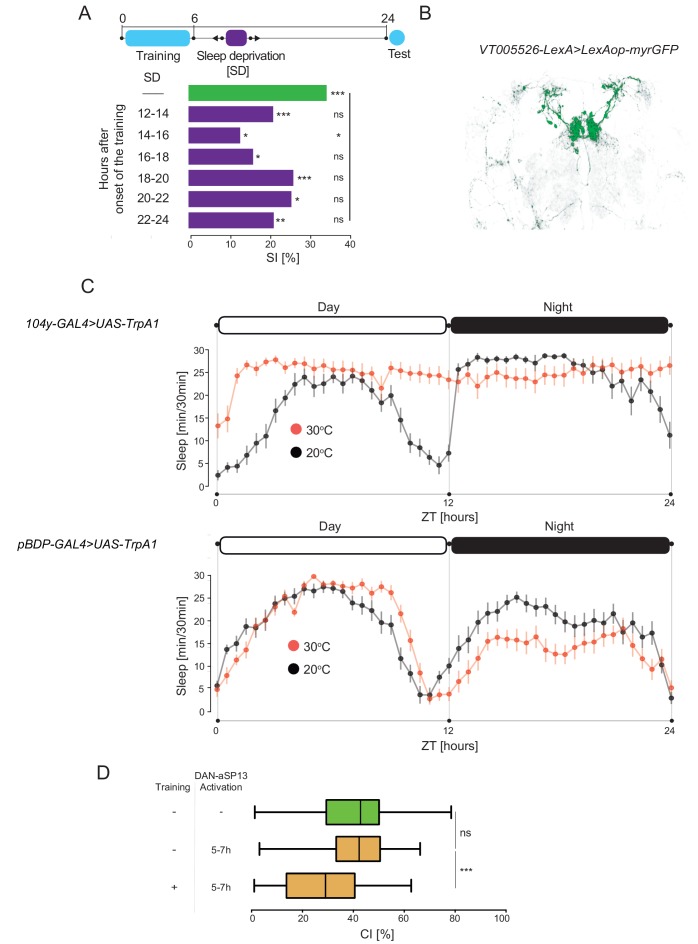
Figure 2—figure supplement 1. Activation of FB neurons induces sleep.

Figure 2—figure supplement 1.

(A) SIs of the wild-type males after 6 hr training with a mated female and sleep deprived during night at indicated time periods (dark purple bars). SI of the control males which were not deprived of sleep (green bar). P value is for Ho SI = 0; ***p<0.001, **p<0.01, *p<0.05, ns p>0.05. Permutation test. (B) Expression pattern of VT005526-LexA line (C) (upper panel) Sleep profile of males (104y-GAL4 > UAS-TrpA1) with 104y neurons activated (30°C, red, n = 16) and not activated (20°C, black, n = 16). (lower panel) Sleep profile of the genetic control males (pBDP-GAL4 > UAS-TrpA1) at 30°C (red, n = 32) and 20°C (black, n = 32). Sleep time was plotted in 30 min bins. White and black areas indicate 12 hr light and dark periods, respectively. (D) CIs of the naïve and experienced males trained for 1 hr with mated female and DAN-aSP13 activated as indicated. Ho CIcontrol = CInaiveact ns p>0.05; Ho CInaiveact = CItrainedact ***p<0.001. Mann-Whitney-Wilcoxon test.
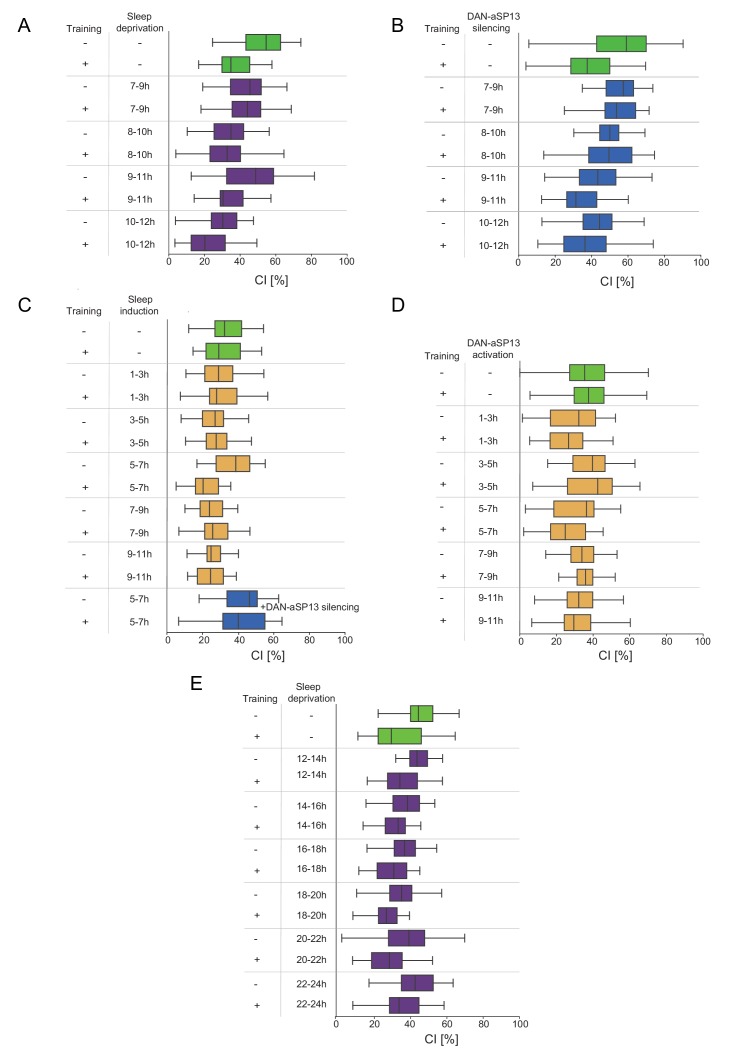
Figure 2—figure supplement 2. Courtship Indices (CIs) of males that had undergone treatment according to Figure 2 and Figure 2—figure supplement 1A.

Figure 2—figure supplement 2.

(A) Courtship indices (CIs) of the wild-type males trained in single pair assays with a mated female and sleep deprived as indicated in Figure 2A and Table S4. (B) Courtship indices (CIs) of males trained in single pair assays with a mated female and DAN-aSP13s silenced as indicated in Figure 2B and Table S6. (C) Courtship indices (CIs) of males trained in single pair assays with a mated female and sleep induced as indicated in Figure 2C and Table S7. (D) Courtship indices (CIs) of males trained in single pair assays with a mated female and DAN-aSP13s activated as indicated in Figure 2D and Table S8. (E) Courtship indices (CIs) of males trained in single pair assays with a mated female and sleep deprived as indicated in Figure 2—figure supplement 1A and Table S5.