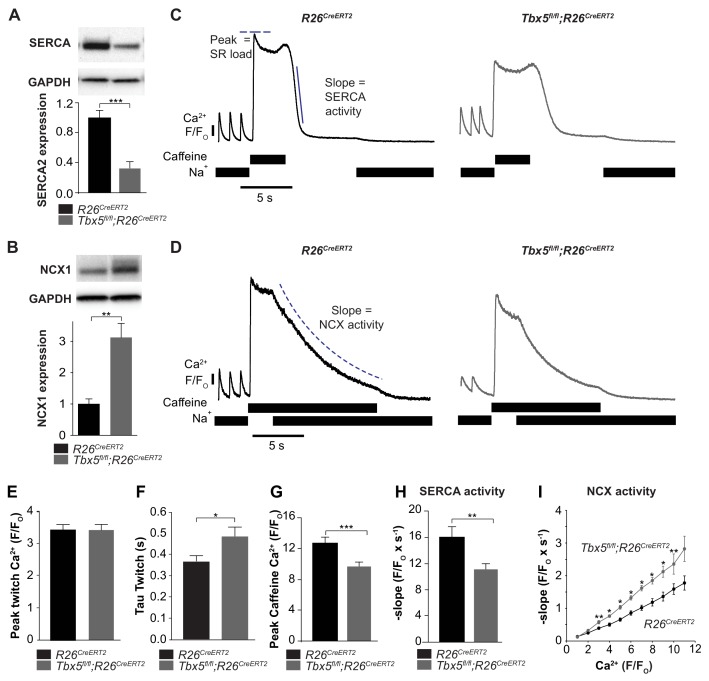
Figure 4. SERCA function is decreased while NCX function is increased in Tbx5fl/fl;R26CreERT2 atrial cardiomyocytes.
(A) Expression of SERCA2 was significantly decreased (normalized to GAPDH) while (B) expression of NCX1 was significantly increased in Tbx5fl/fl;R26CreERT2 atria compared to R26CreERT2 atria as measured by western blot in 10 animals per genotype. (normalized to GAPDH) (C) Application of Na+ free caffeine solution after pacing to steady state at 1 Hz provided a measurement of SR load. In the absence of extracellular Na+, [Ca2+]i plateaued at high levels due to negligible role of non-NCX mediated extrusion in R26CreERT2 and Tbx5fl/fl;R26CreERT2 atrial cardiomyocytes. Removal of caffeine in the absence of external Na+ provided a measure of SERCA mediated SR calcium uptake (representative traces). (D) Restoration of external Na+, in the presence of sustained extracellular caffeine provided a measure of NCX mediated calcium efflux (representative traces). (E) The peak of steady state twitch [Ca2+]i transients was similar but (F) tau of [Ca2+]i decay, determined from twitch [Ca2+]i transients, was increased in Tbx5fl/fl;R26CreERT2 compared to R26CreERT2 cardiomyocytes (myocytes/mice; n = 27/6 R26CreERT2, n = 28/6 Tbx5fl/fl;R26CreERT2). (G) SR load, determined from peak caffeine transients was decreased in Tbx5fl/fl;R26CreERT2 compared to R26CreERT2 cardiomyocytes (myocytes/mice; n = 34/6 R26CreERT2, n = 32/6 Tbx5fl/fl;R26CreERT2). (H) SERCA activity, determined from the maximal rate of calcium decay was diminished in Tbx5fl/fl;R26CreERT2 compared to R26CreERT2 cardiomyocytes (myocytes/mice; n = 29/3 R26CreERT2, n = 32/3 Tbx5fl/fl;R26CreERT2). (I) NCX activity (decay slope), was increased at all levels of calcium in Tbx5fl/fl;R26CreERT2 cardiomyocytes (myocytes/mice; n = 35/3 R26CreERT2, n = 21/3 Tbx5fl/fl;R26CreERT2). (*p<0.05, **p<0.01, ***p<0.001).


