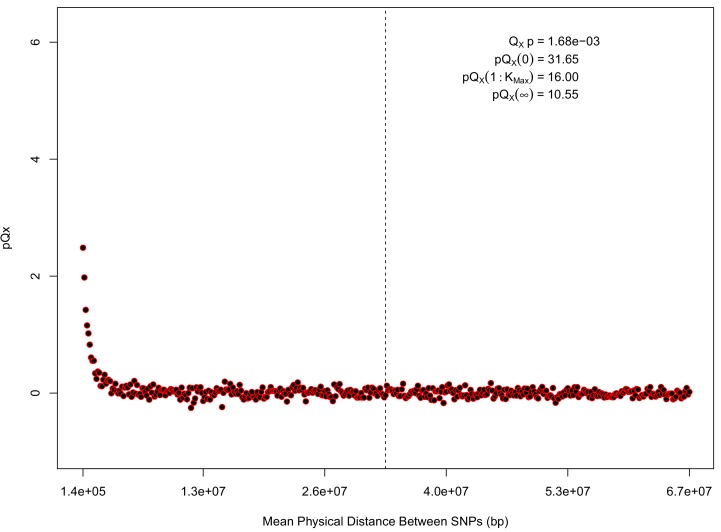
Appendix 1—figure 1. statistics for for the 20 k dataset.
The x axis gives the average physical distance between all pairs of SNPs contributing to a given statistic. The uptick in on the left side of the plot (i.e. small values of ) indicates that SNPs which are physically close to one another and have the same sign in their effect on height covary across population disproportionately as compared to more distant pairs of SNPs. Note that the number of pairs of SNPs contributing to a given decreases as increases, as smaller chromosomes have fewer pairs at larger distances than they do at shorter distances. This leads to a decrease in the variance of under the null as increases. However, this decline in variance is not responsible for the decay in signal as increases, as remains approximately constant until well past the dashed vertical line, which indicates the distance between between the ends of chromosome 21 (the shortest chromosome, and therefore the first to drop out of the calculation).

