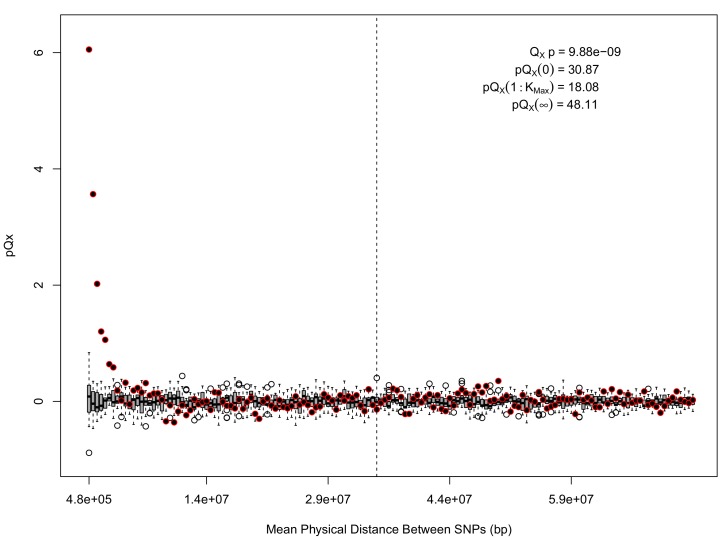
Appendix 1—figure 3. statistics for for the HapMap5k dataset.
The x axis gives the average physical distance between all pairs of SNPs contributing to a given statistic. The boxplots give an empirical null distribution of statistics derived from permuting the signs of all effect sizes independently (this empirical null was omitted from Appendix 1—figure 1 due to computational expense). The uptick in signal from pairs of SNPs physically nearby to one another is present in this dataset, again suggesting a role for physical linkage in contributing to the signal. However, note that in contrast to the 20 k and 5 k ascertainments, the HapMap5k ascertainment also has a large amount of signal from , which cannot be explained by linkage.

