. 2019 Mar 21;8:e39725. doi: 10.7554/eLife.39725

Figure 4. LD Score regression analyses.

(A), (B), and (C) LD Score covariance analysis of SDS with GIANT, R15-sibs, and UKB-GB, respectively. The x-axis of each plot shows LD Score, and the y-axis shows the average value of the product of effect size on height and SDS, for all SNPs in a bin. Genetic correlation estimates are a function of slope, reference LD Scores, and the sample size Bulik-Sullivan et al. (2015a). Both the slope and intercept are substantially attenuated in UKB-GB. (D), (E) and (F) Genetic covariance between GBR-TSI frequency differences vs. GIANT, R15-sibs, and UKB-GB. GIANT and R15-sibs show highly significant nonzero intercepts, consistent with a signal of population structure in both datasets, while UKB-GB does not. In addition, R15-sibs shows a significant slope with LD Score.

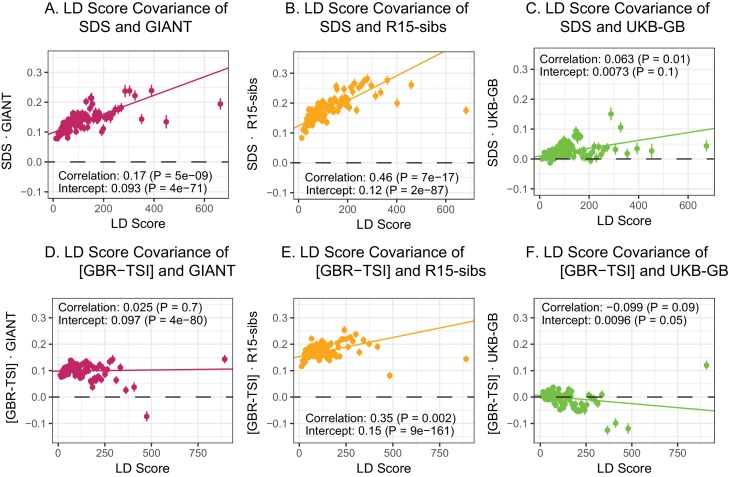
Figure 4.

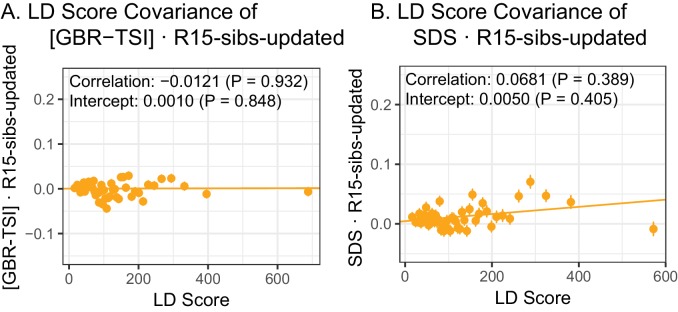
Figure 4—figure supplement 1. The R15-sibs-updated dataset shows no evidence of LD Score regression slope with [GBR-TSI] or with SDS.

Figure 4—figure supplement 1.

(A) The ‘genetic correlation’ estimates of the difference in allele frequency between GBR and TSI from 1000 Genomes versus the R15-sibs-updated dataset. (B) The ‘genetic correlation’ estimates of SDS versus the R15-sibs-updated dataset.
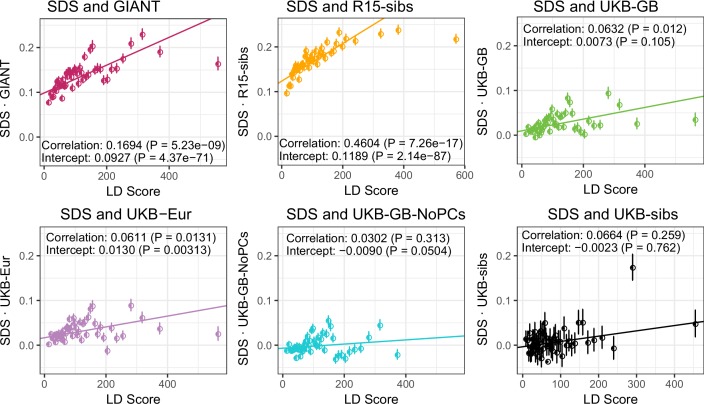
Figure 4—figure supplement 2. UK Biobank datasets show little evidence of bivariate LD Score regression slope when analyzed together with SDS.

Figure 4—figure supplement 2.

Bivariate LD Score analyses of SDS with each of the height datasets.
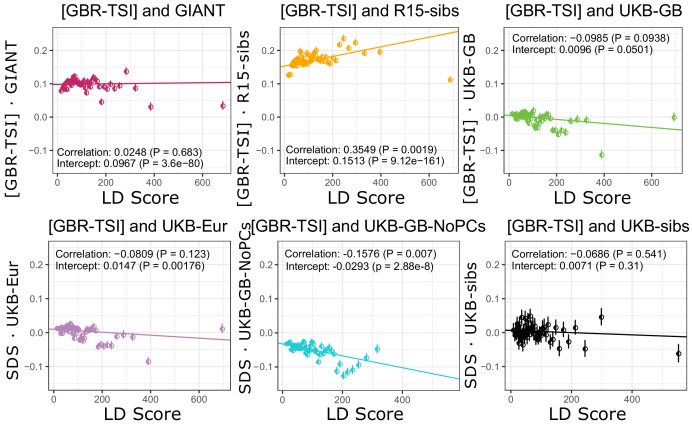
Figure 4—figure supplement 3. Similarly, no dataset has a significant positive slope for [GBR-TSI].

Figure 4—figure supplement 3.

GIANT and R15-sibs show highly significant intercepts. The ‘genetic correlation’ estimates of the difference in allele frequency between GBR and TSI from 1000 Genomes versus each of the height traits under study.