
Figure 4. SmarT-cells maintain CD4+ and CD8+ T cell content in presence of pancreatic tumor signature.
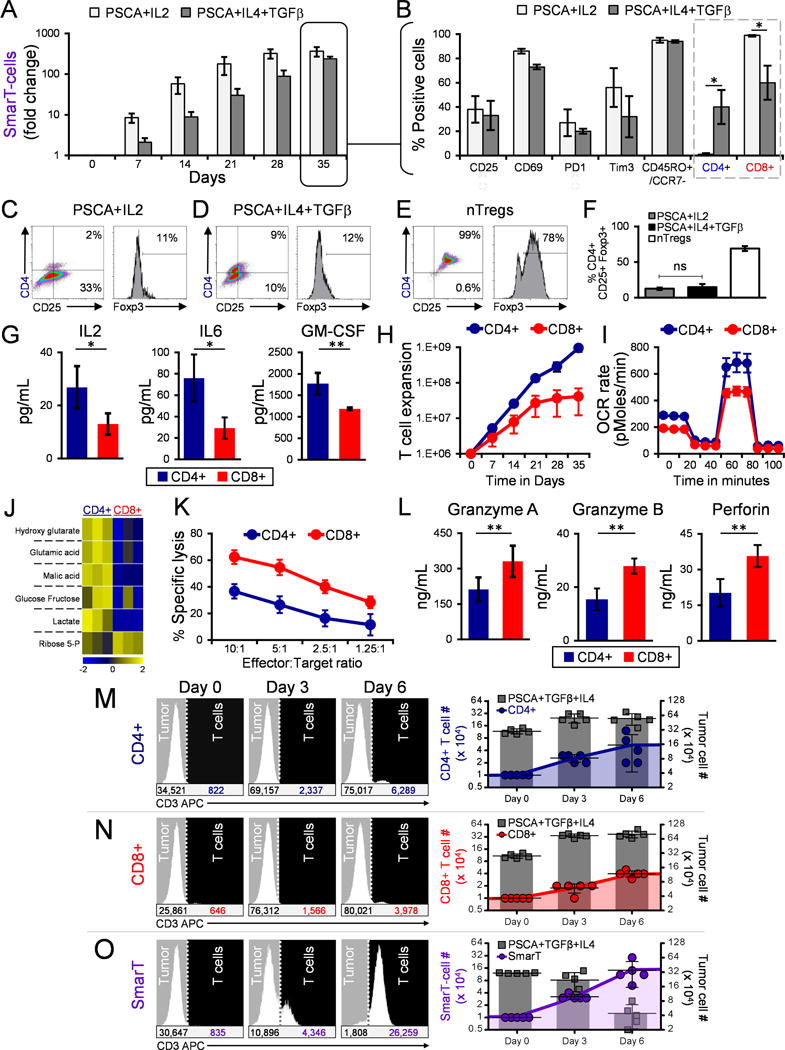
(a) Expansion and (b) phenotype profile (on day 35) of SmarT-cells cultured in PSCA, TGFβ and IL4 compared to standard IL2 condition (mean±SEM, n=3-4). (c,d) CD4/CD25/Foxp3 staining of SmarT-cells cultured in PSCA, TGFβ and IL4 compared to IL2 on day 25. (e) CD4/CD25/Foxp3 staining of freshly isolated naturally occurring Tregs (nTregs) expanded ex vivo to serve as a control. (f) Graph representing %CD4+/CD25+/Foxp3+ SmarT-cells cultured PSCA/TGFβ\IL4 vs IL2 (mean±SEM, n=5), and nTregs (mean±SD, n=2). (g) Cytokine production (h) Proliferative capacity, (i) Mitochondrial function, (j) Metabolomic profile (k) Killing capacity and (l) Effector molecule secretion from sorted CD4+ and CD8+ SmarT-cells assessed on day 10 after culture in tumor milieu conditions (mean±SD, n=3-4). (m-o) Representative histogram plots of sorted CD4+, CD8+ or bulk SmarT-cells co-cultured with PSCA, TGFβ and IL4 expressing targets and analyzed following CD3 staining (left panel). Graphs representing total T cell and tumor numbers calculated using counting beads, and assessed from five independent co-culture experiments (mean±SEM) (right panel). Statistical analysis for panels b, f, g and l was performed using a student’s two-tailed t-test (*p < 0.05; **p < 0.01; ***p < 0.001; ****p < 0.0001, ns = not significant).