
Fig. 4 |. Machine learning models accurately predict orthogonal validation sequencing results.
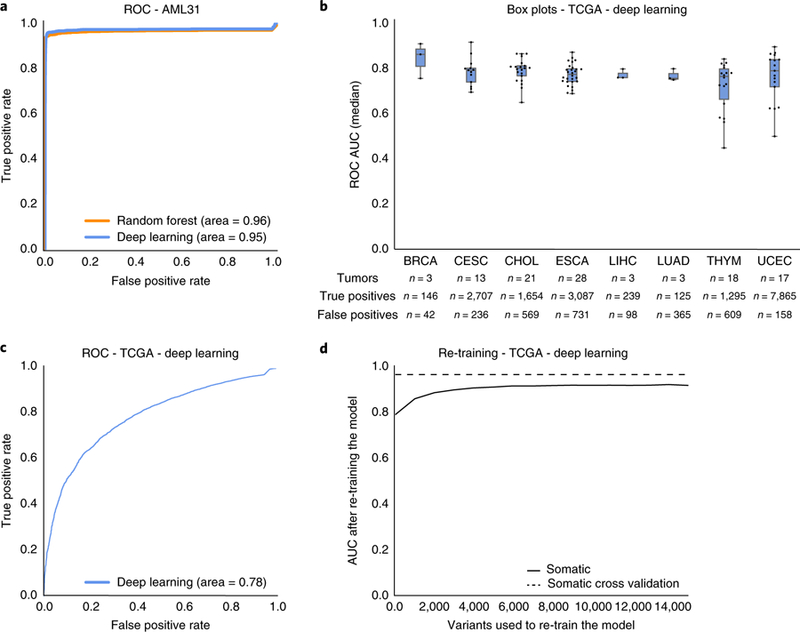
a, A single AML case with 312× genome sequencing had seven automated somatic variant callers identify 192,241 putative somatic variants. Orthogonal sequencing at ~1,000× was performed for all 192,241 variants to identify true positives and false positives. The random forest and deep learning models predicted labels for all variants using the 312× genome sequencing data as input. Model accuracy was determined by comparing model predictions to orthogonal sequencing labels. b, Box plots describe the median ROC AUC for each of eight TCGA cancer types (n = 106 tumor/normal pairs (see Supplementary Table 3 for abbreviations; n = 19,917 variants)). Each dot represents a single TCGA tumor/normal pair, the center represents the 50th percentile, the lower and upper limits of the box represent 25th and 75th percentiles, respectively, and whiskers represent data minimum and maximum. The table below the boxplots shows information on the total number of samples assayed and the distribution of true positive and false positive calls for each cancer type. c, ROC AUC for all TCGA data (n = 19,917 variants) using the deep learning classifier trained on the 41,000 variants described in Table 1. d, Change in ROC AUC after re-training the deep learning model with increments of the TCGA data. TCGA data was partitioned in random stratified increments of 5% (from 0–75%) and used to train a new model (increments = 1,327 variants). The x axis outlines the number of test variants included in re-training. The y axis plots the resulting model’s ROC AUC.