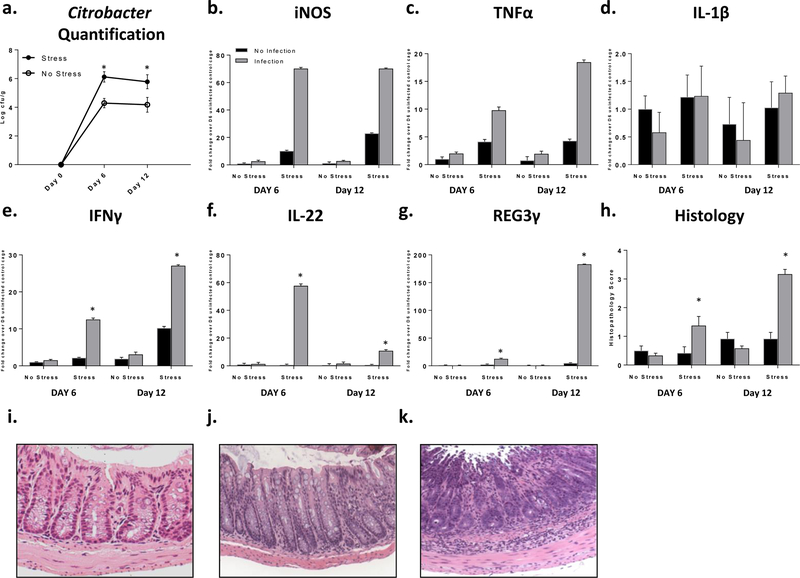
Figure 2: Stress exposure increased C. rodentium levels and inflammation.
a. Citrobacter rodentium levels increased with stress (p<.05). b and c. iNOS and TNFα main effect of stress and infection exposure (p<.05). d. IL-1β main effect of stress exposure (p<.05). e. IFNγ *p<.05 stress x infection interaction. f. IL-22 *p<.05 stress x infection interaction. g. REG3γ *p<.05 stress x infection interaction. h. Histopathology *p<.05 vs no infection same day. i-k. Representative images i. mild inflammation, infection exposed euthanized day 6. j. moderate inflammation, infection and stress exposed euthanized day 6. k. severe inflammation, infection and stress exposed euthanized day 12. 20X magnification.

