
Figure 3:
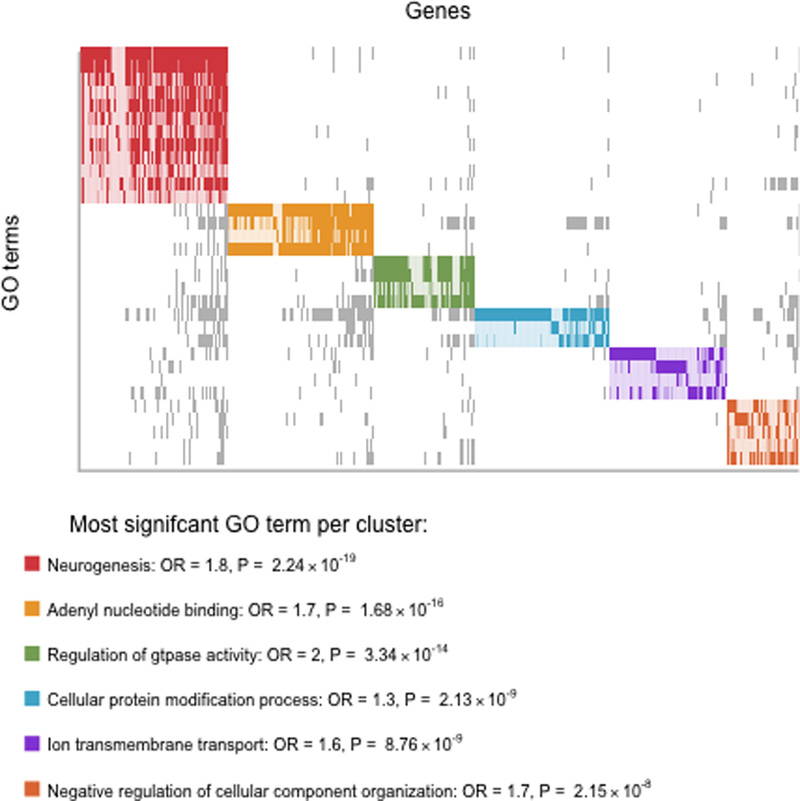
Top. Plot showing level-5 Gene Ontology (GO) terms significantly (P < 0.0001) enriched for genes present in top MWAS results that overlap between blood and brain. Solid rectangles (grey or colored) indicate overlapping genes present in the significant GO terms. GO terms were grouped in color-coded clusters based on the similarity in gene content. Bottom. For each cluster, information (name, odds ratio (OR) and enrichment P value) of the most significant GO term is given. An extended list of all level-5 GO terms with P <0.01 are given in Table S8.