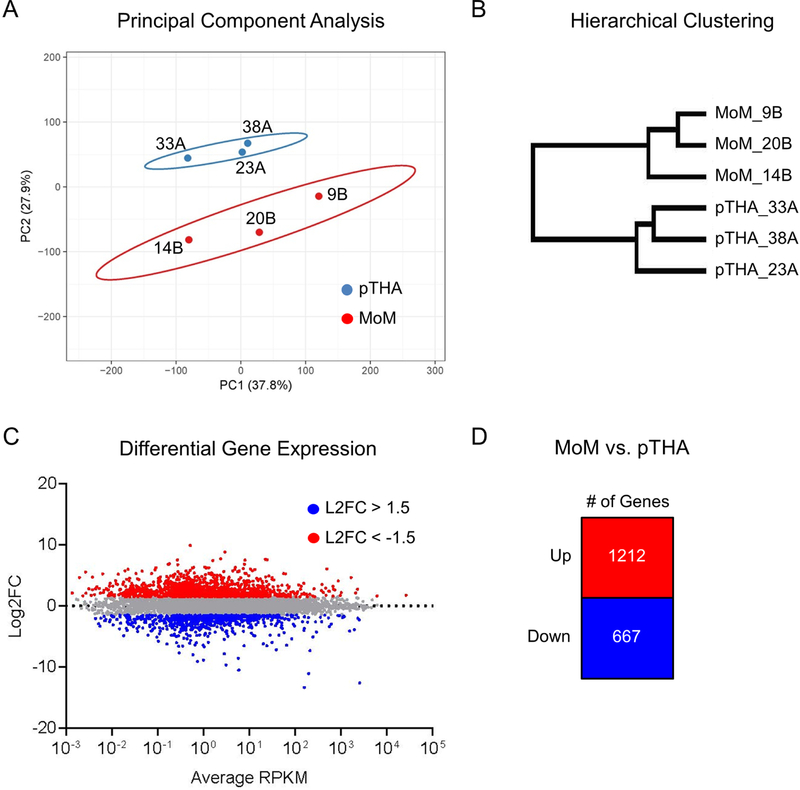
Figure 2.
Synovial tissue derived from metallosis patients has a distinct gene expression profile. Unsupervised principal component analysis (A) and hierarchical clustering (B) was performed using expression profiles of genes expressed > 0.3 RPKM (n= 15,158) across all six specimens. Comparative analysis of expression data in metallosis patients (n=3) versus normal control (n=3) yields sets of upregulated (red) and downregulated (blue) genes (C) as summarized in (D).

