Figure 1.
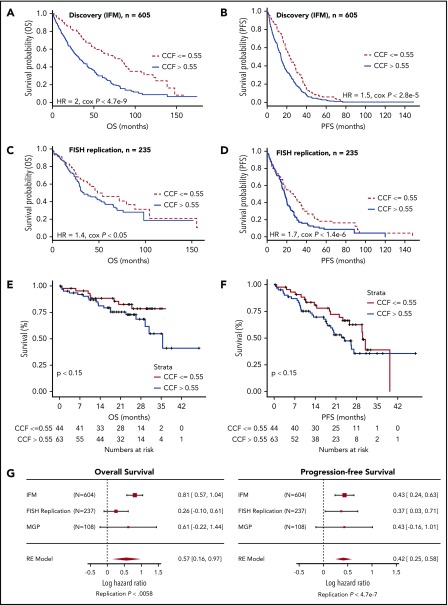
Identification of 0.55 CCF threshold for del17p/TP53 deletion predictive of survival. Kaplan-Meier plot showing OS (A,C) and PFS (B,D) for patients from discovery cohort (A-B) and replication (RE) cohort (C-D) stratified by high or low CCF value. (E-F) Kaplan-Meier plots were generated for OS (A) and PFS (B) characteristics of patients in MGP del17p cohort stratified by 0.55 CCF value (hazard ratio [HR], 1.8; Cox P < .15 and HR, 1.5; Cox P < .15 for OS and PFS, respectively). Baseline OS and PFS data were not available for 1 patient in the CCF >0.55 group. (G) Meta-analysis shows replication of 55% CCF threshold to be an indicator of poor prognosis based on OS and PFS end points. Numbers on the right of each graph indicate HR and corresponding 95% confidence interval.

