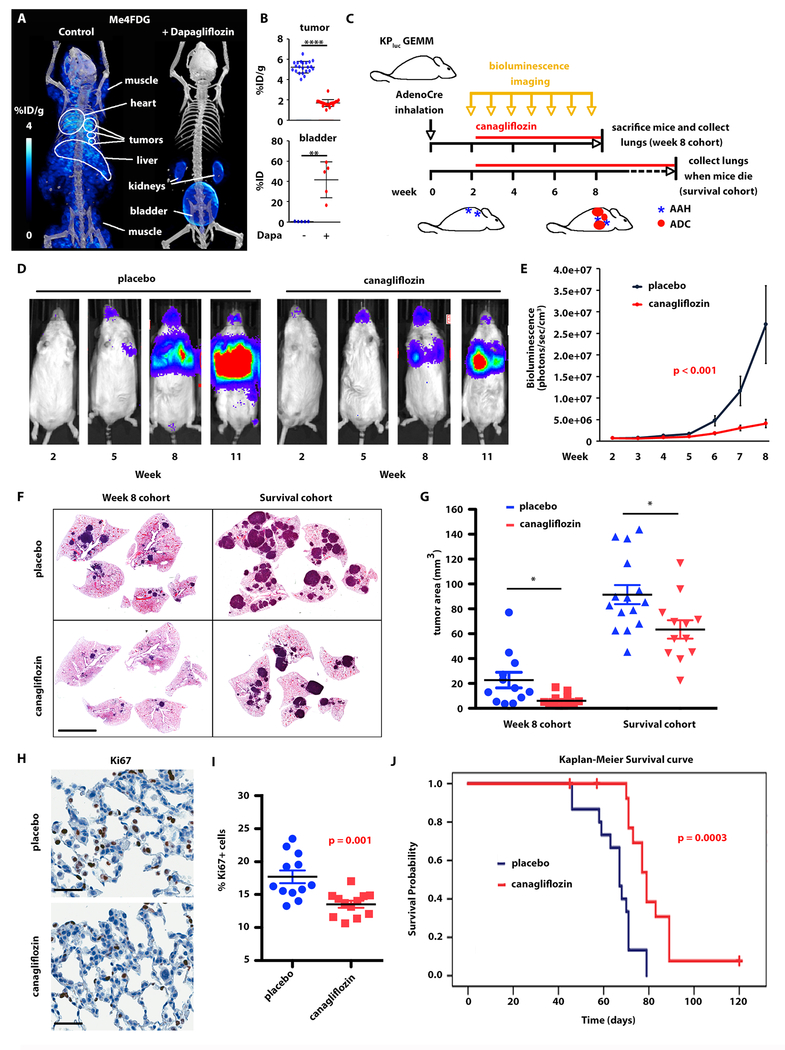
Fig. 4. SGLT2 inhibition delays development of lung adenocarcinomas in KPluc GEMMs.
A-B) The effect of single-dose SGLT2 inhibitor dapagliflozin on SGLT activity was evaluated by Me4FDG PET. A) Representative 3D rendering of the PET/CT in the same KPluc mouse imaged on different days with Me4FDG without or with co-injection of dapagliflozin. B) Comparison of Me4FDG uptake in n = 5 mice, expressed in percent of injected dose per gram of tissue (% ID/g) in regions of interest corresponding to single lung nodules (upper panel) and to the bladder (lower panel). Uptake was compared between groups using the two-sample t-test. ****p < 0.0001; **p < 0.01. C) Schematic representation of the therapeutic trials. GEMM: genetically engineered mouse model. AdenoCre: adenovirally encoded Cre recombinase. AAH: atypical adenomatous hyperplasia. ADC: adenocarcinoma. D-J) Therapeutic trial in KPluc mice treated with placebo or canagliflozin starting 2 weeks after tumor induction and carried on for either 6 weeks (Week 8 cohort) or up to 3 months (Survival cohort). D) Representative images of bioluminescence in two mice belonging to the two treatment groups. E) Quantification of the bioluminescent signal in the two therapeutic groups over time. The p-value presented was from the interaction term between time/group from a generalized estimating equation (GEE) model (56). F) Representative hematoxylin and eosin stain of mouse lungs in the two treatment groups from both trials. Scale bar: 5 mm. G) Quantification of the tumor area in the Week 8 and Survival cohorts. Tumor size was compared between placebo and canagliflozin groups using the two-sample t-test. *p < 0.05. H-I) Ki67 staining in premalignant lesions: H) representative images; I) quantification of the signal in the two groups. The groups were compared using t-test. Scale bars: 50 μm. J) Overall survival curves for each group were constructed using the Kaplan-Meier method and formally compared using the log-rank test.

