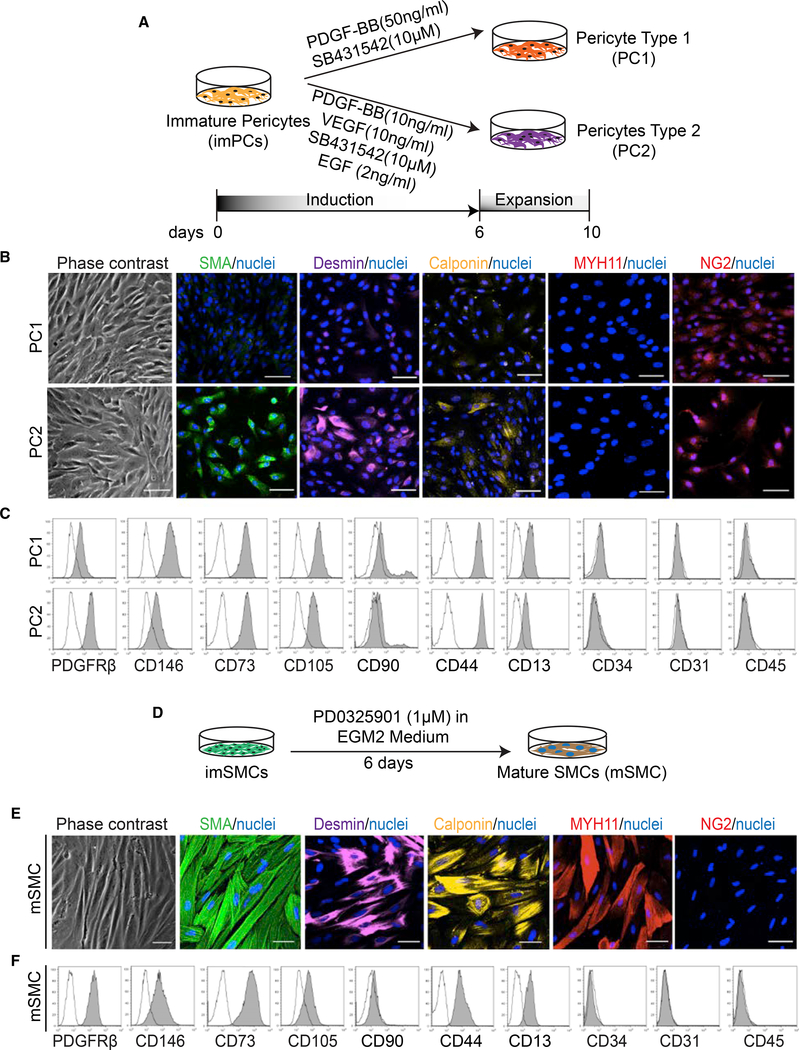
Figure 2. Generation and Characterization of PC1, PC2, and mSMCs.
(A) Schematic illustration of the strategy used for induction of PC1 and PC2 from imPCs.
(B) Immunohistochemistry analysis of SMC and PC markers in PC1 and PC2. Nuclei (blue) were co-stained with DAPI. Scale bar, 50 μm.
(C) Flow cytometry analysis of PC1 and PC2.
(D) Schematic illustration of the strategy used for the induction of SMC maturation.
(E) Immunohistochemistry analysis of SMC and PC markers in mSMCs. Nuclei (blue) were co-stained with DAPI. Scale bar, 50 μm.
(F) Flow cytometry analysis of mSMCs. Images in (B) and (E) and histograms in (C) and (F) are representative of three experiments.

