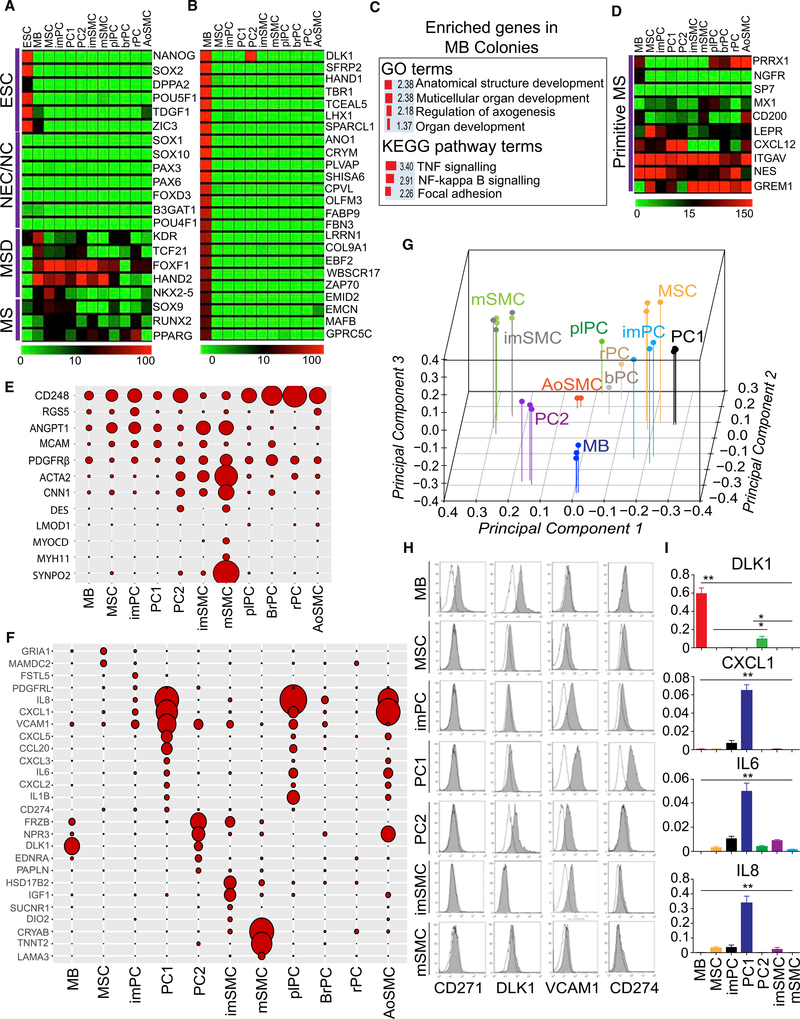
Figure 3. Gene Expression Profiling Reveals a Unique Molecular Signature of MB-Derived Mural Cells.
(A) Heatmap of a selected set of genes associated with the development of germ layers and their derivatives. MS, Mesenchyme; MSD, mesoderm; NEC, neuroectoderm; NC, neural crest. Gene expression is estimated in transcripts per million (tpm) values.
(B) Heatmaps for the 24 representative genes uniquely overexpressed in MB colonies (MB) as compared to MB-derived mesenchymal cells (MSCs, PCs, and SMCs). A pool of 18 libraries representing triplicates of PC1, PC2, imPC, imSMC, mSMC, and MSC was used as a reference to detect MB-specific expression markers.
(C) The classification of genes uniquely overexpressed in MB colonies as compared with downstream progeny. Enrichment scores (expressed as −log10(FDR)) for Gene Ontology (GO) and KEGG pathways are shown.
(D) Heatmaps show the expression of genes associated with the most primitive mesenchymal cells (MS).
(E) Balloon graph shows relative expression of typical PC and SMC genes in hPSC-derived mesenchymal cells. The largest area corresponds to 610.75 units. ACTA2 was downscaled four times for more representative visualization of other markers.
(F) Balloon graph shows relative expression of selected genes differentially expressed in MB-derived MSCs and mural cells. The largest area corresponds to 2, 275 units.
(G) PCA of transcriptome data for the 11 cell types (points are colored according to individual sample label).
(H) Flow-cytometric analysis confirms the differences in the expression of the indicated molecules found by RNA-seq analysis.
(I) qRT-PCR confirmed the differences in gene expression found by RNA-seq. Results shown are mean ± SE of three independent experiments (**p < 0.001, *p < 0.01).
plPC, placental PC; brPC, brain PC; rPC, retinal PC; aoSMC, aortic SMC. Heatmaps in (A), (B), (C), and balloon graphs in (E) and (F) depict mean of three independent experiments with hPSC-derived mural cells, two independent experiments with aortic SMCs, and RNA-seq data of somatic PCs from a single experiment.
See also Figures S4–S6.

