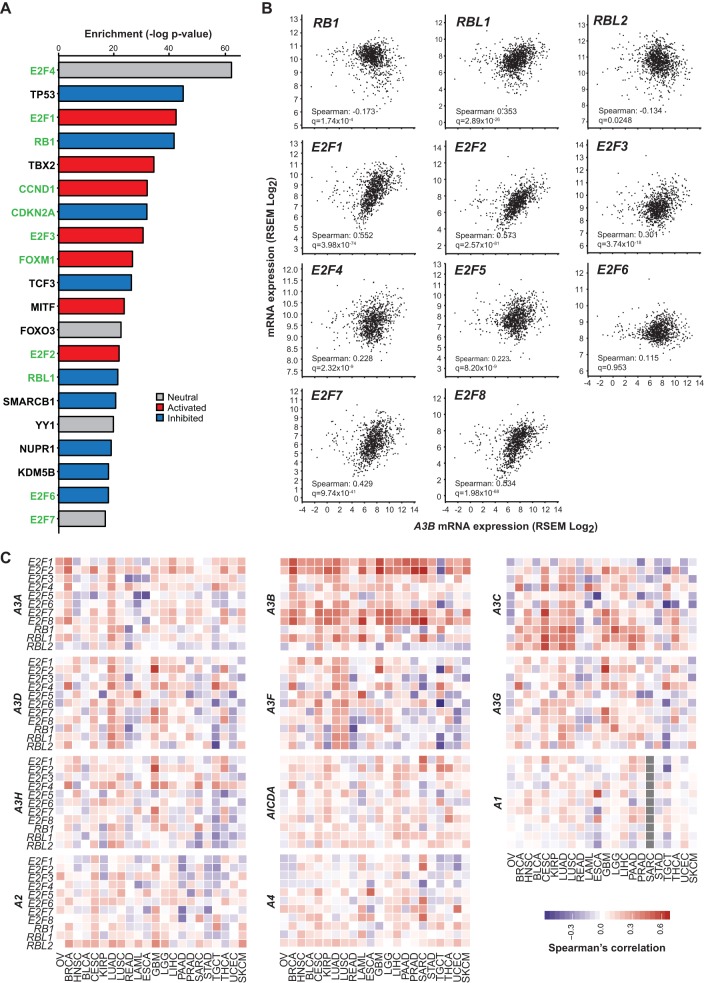
FIG 6.
Evidence for A3B regulation by the RB/E2F pathway in tumors. (A) Top 20 hits from IPA enrichment analysis of upstream transcriptional regulators of A3B in TCGA breast cancer with RB-pathway/cell cycle-related genes highlighted in green. Negative logs of enrichment P values are shown in the bar graph on the right colored by predicted activation (red) or inhibition (blue) of the specific transcription factor. (B) Scatter plots showing the correlation between A3B mRNA levels and transcription factors in the RB pathway with Spearman’s correlation coefficient and q value reported in the lower left corner of each subpanel. (C) Spearman’s correlation coefficient values for all APOBEC-family members against RB pathway transcription factors across 22 cancers ordered by hierarchal clustering. Negative correlations are shown in blue, positive correlations are shown in red, and no data is represented by grey.

