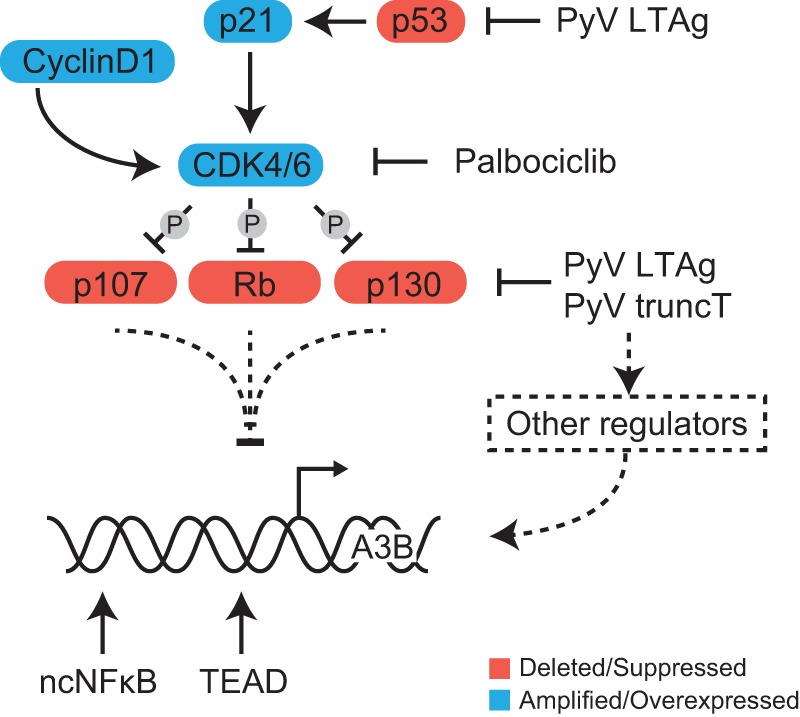
FIG 7.

Model for A3B transcriptional regulation. Schematic of the cell cycle-related proteins affected by T antigen and drug treatments used in this study with implications for A3B transcriptional regulation. Solid lines represent established processes, and dashed lines represent regulatory interactions/pathways implicated by our studies.
