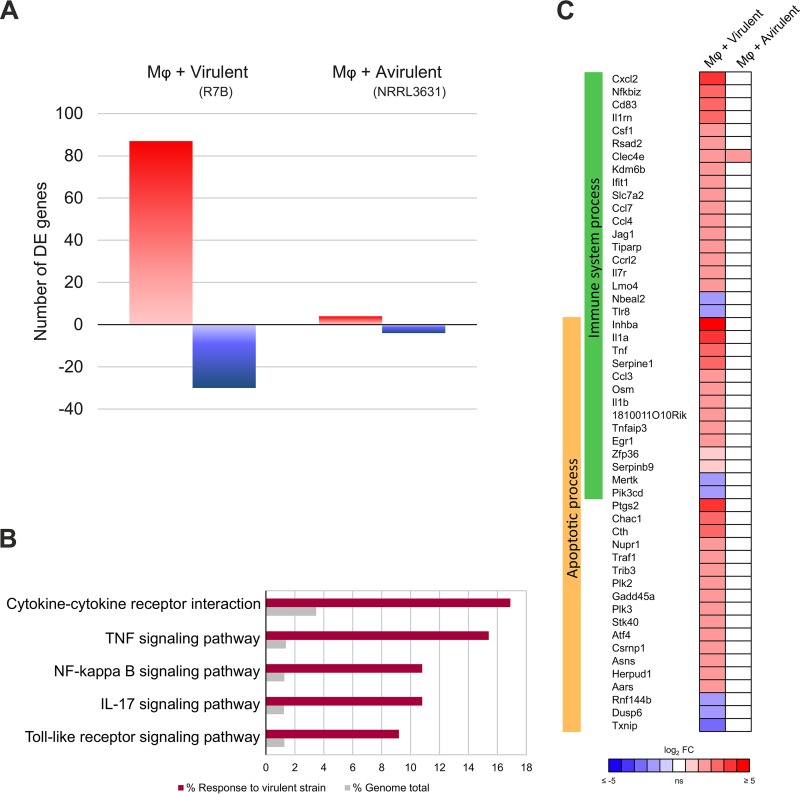
FIG 2.
Macrophages respond exclusively to the virulent Mucor strain. (A) Differential expression (Q ≤ 0.05) of upregulated (red) and downregulated (blue) mouse macrophage (Mφ) (cell line J774A.1) genes induced after phagocytosing spores from each depicted Mucor strain in L15 cell culture medium for 5 h. Differential expression values were calculated by comparison with expression in noninteraction cultures (without spores). (B) Percentage of genes for each significantly enriched (adjusted P value, ≤0.01) KEGG pathway found in the macrophage response to the virulent Mucor R7B strain compared to the expected percentage of genes found in the mouse genome. (C) Differential expression values (Q ≤ 0.05) of selected mouse macrophage (Mφ) (cell line J774A.1) genes induced after phagocytosing spores from each depicted Mucor strain for 5 h. The selected genes are involved in two enriched GO Biological Processes (adjusted P value, ≤0.05), Immune System Process and Apoptotic Process. FC, fold change.

