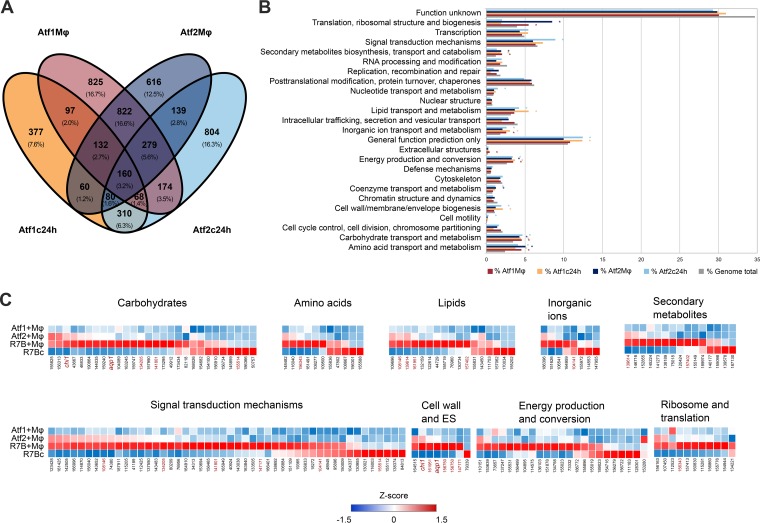
FIG 5.
Atf1- and Atf2-regulated genes. (A) Venn diagram showing the relationships between differentially expressed genes (Q ≤ 0.05) in Mucor atf1Δ and atf2Δ mutants. Differential expression values were calculated as the ratio between the expression in virulent wild-type strain R7B and in each depicted mutant, either cocultured with mouse macrophages (cell line J774A.1) in L15 cell culture medium for 5 h (Mφ) or grown in liquid MMC, pH 4.5, for 24 h (c24h). Overlapping genes shared similar expression values (up- or downregulation) under the depicted conditions. (B) Percentages of genes regulated by Atf1 (red and orange) and Atf2 (dark and light blue) and of all genes found in the genome (gray) for each KOG class. Asterisks (*) indicate a significant enrichment (P ≤ 0.05, Fisher’s exact test) in the corresponding KOG class with respect to the expected number of genes found in the Mucor genome. (C) Analysis of genes upregulated (Q ≤ 0.05, fold change of ≥2.0) in the virulent wild-type strain R7B compared to their expression in either the Mucor atf1Δ or atf2Δ mutant cocultured with mouse macrophages (cell line J774A.1) for each enriched KOG class found in panel B. Z score was calculated as the deviation from the mean FPKM (fragments per kilobase of transcript per million mapped reads) value in standard deviation units for Mucor atf1Δ and atf2Δ mutants and strain R7B cocultured with mouse macrophages (Atf1+Mφ, Atf2+Mφ, and R7B+Mφ) and for R7B without mouse macrophages (R7Bc). Red gene IDs appear in more than one KOG class.

