Figure 3.
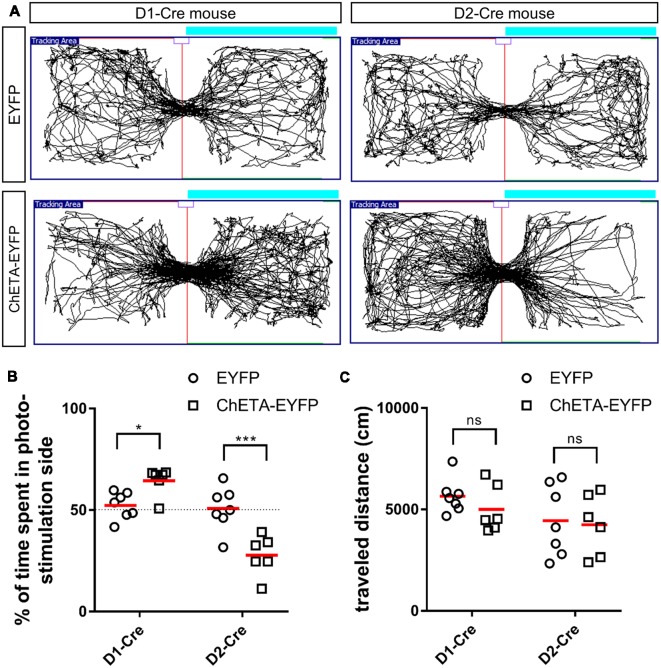
Cell type-specific effect of optogenetic stimulation of the anteromedial OT in the RTPP tests. (A) Tracking data of the RTPP tests. Right side is the photo-stimulation side. (B) Percentage of time spent in the photo-stimulation side in the 20-min RTPP tests. (C) Traveled distance during the 20-min RTPP tests. Data show mean with individual plots. ns, not significant; *p < 0.05; ***p < 0.001. OT, olfactory tubercle; RTPP, real-time place preference.

